Rising and Falling Wedge Patterns
The Wedge formations are reversal patterns that can appear bullish, in the case of a Rising Wedge, or bearish, in the case of a Falling Wedge. In either case, the breakout is often in the opposite direction of the trend that forms in the wedge itself. It is important to note that while the Rising Wedge is often preceded by a downtrend, it can also be found in an uptrend. Similarly, a Falling Wedge is often preceded by an uptrend but it can also be found in a downtrend. The pattern itself does not mark the reversal of the preceding trend; the breakout from the pattern marks the reversal of the trend formed within the Wedge pattern.
The Wedge pattern is similar to the symmetrical triangle as they too have converging trendlines that meet at an apex. They, unlike the symmetrical triangle, are slanted either to the upside, making it a Rising Wedge, or to the downside, making it a Falling Wedge. At least five pivot points (peaks or valleys) are required to form a wedge, with three pivots on the one trendline and two on the other. Volume is an important characteristic of a Wedge and should decrease during the formation of the Wedge and increase on the breakout.
Wedge patterns are also part of the Elliott Wave Principle where they are seen as diagonal triangles. In Elliot Wave theory, however, the wedge must be in the direction of the preceding trend, the motive wave, and cannot be corrective or reactionary.
The Falling Wedge Pattern
A Falling Wedge is a bullish pattern though the price action in the wedge itself would be bearish. The Falling Wedge is bound by two trendlines that have a downward slope with the upper trendline (the resistance line) having a more acute slope, or a steeper slope, than the lower trendline (the support line). This indicates that selling pressure is drying up as sellers are not able to push the price down as effectively as before. The pattern should have at least two test of both the upper resistance trendline and the lower support trendline. The breakout from the Falling Wedge occurs when the price breaks above the upper trendline that was forming a resistance line.
The Rising Wedge Pattern

A Bearish Rising Wedge with its price objective
A Rising Wedge is the opposite of a Falling Wedge. It is a bearish pattern with the price action in the Rising Wedge being bullish. The two trendlines that contain the Rising Wedge formation will have an upward slope with the lower support trendline having a more acute, or a steeper, slope than the upper resistance trendline. This indicates that buying pressure is drying up as buyers are not able to push the price up as effectively as they had done before. As with the Falling Wedge, the Rising Wedge pattern should have at least two test of both the upper resistance trendline and the lower support trendline. However, the breakout from the Rising Wedge will occur when the price breaks below the lower support trendline.
Entry Signal
An entry signal is given when the price breaks out of the Wedge. In a Falling Wedge, the price should break out to the upside; and in a Rising Wedge the price should break out to the bottom. The breakout should be accompanied by an increase in volume. More aggressive traders attempt to enter when the price rebounds from the lower support trendline in a Falling Wedge or the upper resistance trendline in a Rising Wedge.
Price Projection
A price projection of the Wedge pattern can be calculated by taking the widest part of the Wedge and adding it to the breakout point in a Falling Wedge, or subtracting it from the breakout point in a Rising Wedge. Alternatively, the highest peak in a Falling Wedge or the lowest valley or trough in a Rising Wedge can be used as a more conservative price objective. When trading the Wedge pattern it is important to note that there is a tendency for the price to retest the breakout level and in more extreme cases to test the trendline that was breached to give the entry signal.
Chart Example
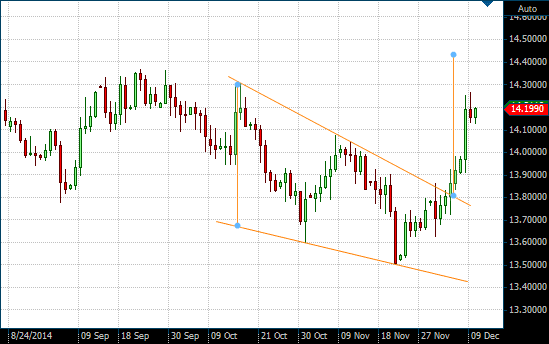
A bullish Falling Wedge pattern can be seen on the following daily forex chart of Euro/ZAR. The Euro/ZAR reached a high of 14.3115 on October 16, 2014 to form the first peak in a Falling Wedge formation. The price then declined to a low of 13.6045 on October 31, 2014 to form a trough before rising to 14.0750 on November 7, 2014, forming the second peak. A resistance trendline could then be drawn over the two peaks. The price then declined to a low of 13.5103 on November 21, 2014. A support trendline could then be drawn connecting the two low points. This forms the Falling Wedge as the lower support line is not as steep as the upper resistance line. On December4, 2014, the Euro/ZAR broke the upper resistance line at 13.793 and closed above it, giving us an entry signal to long the Euro/ZAR. We enter at 13.8645 after the breakout bar had closed above the resistance trendline. Our price objective is the height of the widest part of the Wedge, which starts from the peak made on October 16, 2014. A line is drawn to the lower support line, giving us a height of approximately 6,325 pips. This is added to the breakout point (not our entry point) at 13.7939, giving us a price target of 14.4264 and a potential gain of 5,619 pips! A more conservative trader could have the first peak at 14.3115 as a price target for a gain of 4,470 pips.

Daily or EOD Euro/ZAR chart with Falling Wedge
At the time of writing, the price object hasn't been reached yet, but it is well on the way!