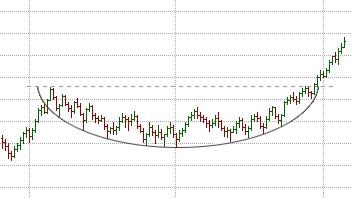
Rounding Bottom Pattern

The Rounding Bottom or Saucer Bottom
The Rounding Bottom pattern, which is also called a saucer bottom, is a rare long-term reversal pattern that is sometimes seen on long time frame charts. This pattern usually takes several months to a few years to form. The length of time the Rounding Bottom takes to form makes it rather difficult to identify. Its appearance is similar the cup section in the cup and handle pattern. Unlike the cup and handle pattern, though, the Rounding Bottom usually appears at the end of a downtrend or during a protracted ranging market.
In the Rounding Bottom pattern, the rate at which prices decline slows and eventually turns up slowly before accelerating gently. These price movements are usually advances and decline with increasingly shallower lows initially followed by increasingly higher highs after the upturn. The time it takes to form the left half of the pattern, i.e., the slowing decline, should be similar to the time it takes to form the slowly accelerating right half of the pattern.
The volume accompanying this pattern is of important in confirming this pattern. The volume should be high at the start of the pattern and should weaken as the price decline slows toward the low. Once the price turns and starts to advance away from the low, volume should also increase.
Entry Signal
The Rounding Bottom gives a long entry signal when the price breaks above the resistance level formed by the peak that marks the start of the pattern. At this point the downtrend is considered to have reversed and an uptrend should form.