Japanese Candlestick Charts
A Candlestick Chart
Japanese candlestick charts form the basis of the oldest form of technical analysis. They were developed in the 17th century by a Japanese rice trader named Homma and was introduced to the rest of the world in Steve Nison's book, Japanese Candlestick Charting Techniques. Candlestick charts provide the same information as OHLC bar charts, namely open price, high price, low price and close price, however, candlestick charting also provide a visual indication of market psychology, market sentiment, and potential weakness, making it a rather valuable trading tool.
Candlesticks indicate a bullish up bar, when the closing price is higher than the opening price, using a light color such as white or green, and a bearish down bar, when the closing price is lower than the opening price, using a darker color such as black or red for the real body of the candlestick. Thus, on a white candlestick, the close price will be at the top of the candlestick real body and the open price at the bottom as the close price is higher than the open price; conversely on a black bar the close price will be at the bottom of the candlestick real body and the open price at the top as the close price is lower than the open price. For both a bullish and a bearish candlestick, the high price and the low and the low price for the session will be indicated by the top and bottom of the thin vertical line above and below the real body. This vertical line is called the shadow or the wick. At times the candlestick will have no real body. This occurs when the candlestick closes at the same price that it opened. This type of candlestick is referred to as a Doji and is usually colored differently to candlesticks that do have a real body.
The shape and color of a candlestick, and its significance, can change several times during its formation. Therefore the trader must wait for the candlestick to be formed completely at the end of the time-frame to analyze the candlestick, forcing the trader to wait for the bar to close. Also, the meaning of the candlestick can differ depending on where it appears on the chart.
Candlesticks are also good indicators of market psychology, i.e., the emotions of fear and greed experienced by the buyers and sellers, and the strength of those emotions. This indication is based on the size, color, and location of the candlestick. The color of the candlestick indicates whether bullish or bearish sentiment dominated, with a white or light-colored candlestick indicating that the bulls are in control while a black or dark-colored candlestick indicates that the bears are in control. The only time that the color of the candlestick is not important is when the candlestick is what is called an umbrella line or an inverted umbrella line. These are candlesticks that have a relatively short real body with little or no shadow on the one side and a long shadow on the other side. Examples of umbrella and inverted umbrella lines are: the Hanging Man, the Hammer and the Inverted Hammer, and the Shooting Star.
Candlestick charts indicate potential trend reversal patterns in only a few candlesticks, usually one to four candlesticks, with subsequent candlestick patterns proving confirmation. When using a candlestick for confirmation of a potential trade signal, it is important to take into account the relative strength or weakness of that candlestick and its location overall in the trend lines on the chart. A weak candlestick should never be taken as a confirmation of a potential trade. Generally, for a bullish confirmation, the candlestick must close higher than the highest high of the candlesticks that formed the pattern or, if it is a single candlestick pattern, the confirmation candlestick must close higher than the high of the single candlestick pattern and the candle that preceded the formation. Conversely, for a bearish confirmation, the candlestick must close lower than the highest high of the candlesticks that formed the pattern or, if it is a single candlestick pattern, the confirmation candlestick must close lower than the high of the single candlestick pattern and the candle that preceded it.
Sometimes the candlestick chart will contain a continuation pattern that usually consists of at least two candlesticks. Regardless of whether it is a trend reversal pattern of a continuation pattern, the candlesticks must be located in an existing trend. Candlesticks in a consolidating, sideways market do not offer any great trading opportunities.
The following two charts of the EUR/USD illustrate the subtle differences between a bar chart and a candlestick chart. The first is the bar chart followed by a candlestick chart. Both charts have a 15-minute time frame and cover the exact same period.
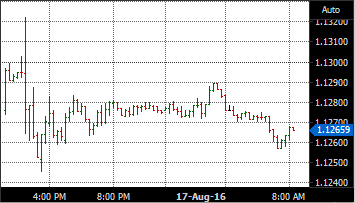
A Bar chart of the Euro/USD
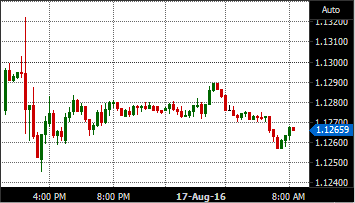
A Candlestick chart of the Euro/USD