Channels and Channel Lines

Channel Lines
At times the price will tend to move in a channel between a trendline and a another line that runs parallel to the trendline. The later is referred to as a Channel Line or a return line. When these are identified, they represent a clear exit point for any open position that was taken at the trendline; i.e., in the direction of the current trend. Aggressive traders may also use the Channel Line as an entry point for a trade against the trend, though trading against the trend is not advisable as those trades tend to carry a higher risk and tend to carry a higher failure rate than trades taken in the direction of the trend. Another significant signal is the failure of the price to reach the Channel Line. This could precede a break of the trendline and a possible reversal of the trend, though the price may first retest the recently broken trendline.
Drawing Channel Lines
In an uptrend, your trendline will be supporting the price line along the reaction or retracement lows. A Channel Line can be drawn along the highs of the peaks parallel to the trendline. Conversely, in a downtrend, your trendline will be along the reaction highs of price line with the Channel Line drawn along the lows of the dips, parallel to the trendline.
The price must bounce off the Channel Line at least twice to confirm the channel. The more test of the trendline and Channel Line, the more significant the channel becomes. But it must be remembered that the trendline always remains more significant than the Channel Line.
Using Channel Lines
An entry signal is given when the price tests the trendline without violating it. In this event, the trade is initiated in the direction of the trend with a stop loss located just below the trendline. The Channel Line can be used as a price target at which to take profit. More aggressive traders may use the test of the Channel Line as an entry for a trade against the trend, with the stop loss set just above the Channel Line and a profit target at the trendline. However, this trade is against the trend and tends to be less successful.
At times the price may bounce off the trendline but fail to reach the Channel Line. This could indicate a weakening of the trend and may precede a break of the trendline. Should the trendline be violated on strong volume, a entry against the trend may be initiated with the stop loss just above the violated trendline with the price projection for taking profit set at the height of the channel in the direction of the trade.
Chart Example
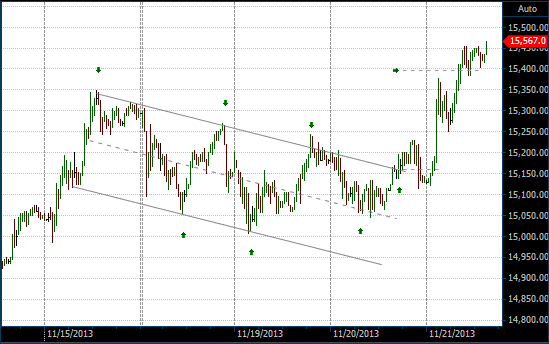
A channel can clearly be seen on the following 30 minute intra-day chart of the Japanese Nikkei 225 Futures Index. The Nikkei 225 was in an uptrend when it initially made a peak at 15,350 at 1:00 PM on November 15, 2013 before falling back to 15,054 at 11:00 AM on November 18, 2013. It then rallied back up but made a lower high at 15,268 at 9:00 PM on November 18, 2013. This formed the second peak for the resistance line. At 3:30 AM on November 19, 2013, the second low was formed at 15,013. The two highs and two lows formed the channel. At 7:00 PM on November 19, 2013, the Nikkei broke through the upper (resistance) Channel Line and closed at 15,232. It wasn't able to maintain this level, falling back into the channel and reaching the mid-channel line before finally breaking out at 8:00 AM on November 20, 2013. The price target at approximately 15,398 was reached at 8:00 the following day.

Trading the Channel on the Nikkei 225 chart