Keltner Channel
What is the Keltner Channel?
The Keltner Channel is a lagging volatility indicator that was originally developed by Chester Keltner in the late 1950s with a revised version developed by Linda Bradford Ranche in the 1980s. The revised version of the Keltner Channel is quite similar to Bollinger Bands in that it also consists of three lines. However, the middle line in a Keltner Channel is an exponential moving average (EMA) and the displacement of the two outer lines is base on the Average True Range (ATR) rather than on standard deviations.
The Keltner Channel also indicates overbought and oversold levels relative to a moving average, especially when the trend is flat, and can used to confirm trading signals. Because the channel is derived from the ATR, which is a volatility indicator, the Keltner Channel also contracts and expands with volatility but is not as volatile as the Bollinger Bands.
How is the Keltner Channel calculated?
The Keltner Channel is calculated by selecting a period for the EMA that will serve as the centerline and a period for the ATR that will be used as a displacement for the channels above and below the center line. Once the EMA and the ATR are selected, you need to select the displacement factor for the outer channel lines.
The default settings for the Keltner Channel are: displacement of two times a 10-period ATR above and below the 20-period EMA. However, the principle behind bands such as the Keltner Channel is that it must encompass most (95%) of the price action. This can be accomplished by adjusting the look-back period for the EMA, the look-back period for the ATR and the displacement factor.
How is the Keltner Channel used?
As the Keltner Channel is based on an EMA, it is suited to trend following trading strategies with price penetrations above the upper line or below the lower line indication strength and weakness respectively. These penetrations could precede a change in trend from bullish to bearish when the lower channel line is penetrated, or form bearish to bullish when the upper channel line is penetrated.
The direction of the channel determines the direction of the trend. Thus, the market is in a downtrend when the channel moves lower, and is in an uptrend when the channel moves higher. The trend is also said to be flat when the channel moves sideways.
It is advisable to trade in the direction of the trend. Therefore, in an uptrend it is possible to use the lower channel line as buy zone with a protective stop placed below the channel and a profit target placed at the upper channel line. In a downtrend it is possible to use the upper channel line as sell zone with a protective stop placed above the channel and a profit target placed at the lower channel line. This strategy uses the outer channel lines as overbought and oversold levels.
Chart Example
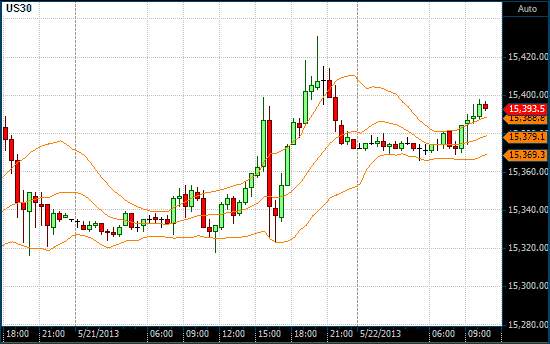
The following chart shows the Keltner Channel in orange on a 30-minute chart of the Dow Jones Industrial Index. The default setting of a 20-period EMA and 2 ATR displacements are used here. Notice how the channel contracts during periods of low volatility and expands during periods of high volatility.

Keltner Channel on a 30 Minute DOW chart
Some history
The original version of the Keltner Channel was developed by Chester Keltner, who called it a "Ten-Day Moving Average Trading Rule" in his book, How to Make Money in Commodities. Keltner was a successful grain trader. In his version, the channel was based on a 10-day simple moving average (SMA) of the typical price, i.e., ( high + low + close ) ÷ 3. This formed the centerline. the two outer channel lines were displaced above and below the centerline by a 10-day SMA of the daily range, i.e., high – low. The outer channel lines served as trading signals on a stop-and-reverse basis.