The Bullish Homing Pigeon Pattern
What is the Homing Pigeon Pattern?
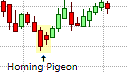
The Bullish Homing Pigeon Pattern
The Homing Pigeon candlestick pattern is a bullish trend reversal pattern that consists of two candlesticks. As it is a bullish reversal pattern, the Homing Pigeon pattern must appear in an established downtrend where it warns of a possible end of that downtrend and the possible beginning of an uptrend. It is similar in appearance to the Inside Day pattern in OHLC bar charts, as well as the bullish Harami candlestick pattern, except that the second candlestick on Homing Pigeon pattern is the same color as the first candlestick while in the bullish Harami pattern it need not be the same color.
The Homing Pigeon Formation
The first candlestick in the Homing Pigeon pattern is a relatively large candlestick with a relatively large real body. This candlestick is supportive of the current downtrend and indicates that the downtrend still has momentum. The second candlestick, however, while also supportive of the current downtrend, shows some weakness in the downtrend. Firstly, it gaps up to well into the body of the previous candlestick and then it fails to drive the price lower that the close of the first candlestick. As a result, the second candlestick in engulfed by the first candlestick.
What the Homing Pigeon Pattern tells us
The Homing Pigeon pattern indicates that the downtrend is losing momentum as buyers are gaining in strength. The first indication of this change in momentum is provided by the open of the second candlestick in the pattern that gaps up and opens well into the real body of the first candlestick. This indicates that bullish buyers are willing to pay higher prices for the equity. The failure of the bears to drive the price down to close lower than the previous session indicates that the bears losing interest and are conceding the initiative to the bulls. As a result, we could expect a trend reversal to emerge, especially if key support levels hold.
Trading the Homing Pigeon Pattern
The Homing Pigeon Pattern is a bullish trend reversal pattern that warns of increasing weakness in an existing downtrend and the probable end of the downtrend. Traders with open short positions should be looking to cover their short positions on the open of the candlestick that follows the Homing Pigeon formation, and will be looking to go long, which means they will be preparing to place buy orders. Aggressive traders, with a great apatite for risk, can open a long position in anticipation of a trend reversal once the price breaks above the second candlestick in the Homing Pigeon formation, especially if the Homing Pigeon is formed at a key support level. More conservative traders would wait for the candlestick that follows the formation to confirm the pattern before entering a long position on the open of the subsequent candlestick. In either event, a logical place to put a stop loss would be the low of the formation as a break below the Homing Pigeon pattern would negate the pattern.
The Homing Pigeon pattern does not provide a clear profit target; therefore, other methods or candlestick patterns should be used to exit the short position. This could be a profit target based on a defined risk/reward ratio, a Fibonacci retracement level, the appearance of a bullish candlestick formation, or a simple trailing stop.
As with most trend reversal patterns, the Homing Pigeon pattern becomes more reliable when it appears in the vicinity of trend lines, pivot points, and support and resistance lines, etc. A Homing Pigeon pattern at or near a trendline or a resistance line can be used as confirmation that the test of the trendline is more likely to hold. Furthermore, traders can use the Homing Pigeon pattern in conjunction with an oscillating indicator, such as the RSI, that shows the security to be oversold.