Renko Charts
A Renko Chart
Renko charts are a Japanese chart type that has been brought to the West's attention by Steve Nison, in his book, Beyond Candlesticks: New Japanese Charting Techniques Revealed. Renko charts are based on point and figure charts. It is called 'renko' charts because of its structure. The word 'renko' is derived from the Japanese word 'renga', which means bricks, and the structure of Renko chart shows a stack of bricks or boxes arranged diagonally in the trend with each brick having the same dimensions. As with point and figure charts, a new brick is only drawn on a Renko charts when the close price has advance or declined by at least a predetermined fixed amount above or below the previous brick or box, with a brick or box bring drawn for each multiple of the fixed amount that the price action has exceeded the top or the bottom of the previous brick. Thus, the price movement of a given time period or time-frame can be represented by one brick, numerous bricks or no brick.
For example, if the chart has a predetermined size of five points, and the top of the last brick is 100, a bullish hollow brick is only drawn when the price action in the next time period closes above 105 with additional hollow bricks being drawn for every five points higher close is. Thus, if the closes at 103, no brick is drawn as the price has not advanced by the predetermined amount, and if the price closed a 123 points, four rising bricks would be drawn: the first from 100 to 105, the second from 105 to 110, the third from 110 to 115, and the fourth from 115 to 120. Each of these bricks is drawn in the next column to the right, making the chart time independent. Also, in the case of the price moving to 123, low of the last brick would be 115. In order for a bearish black brick to be drawn, the price in the following time period would need to close at least five points below the last brick, which had a low of 115. in other words, it would need to close at 100 or lower for at least one bearish black brick to be drawn.
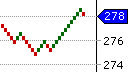
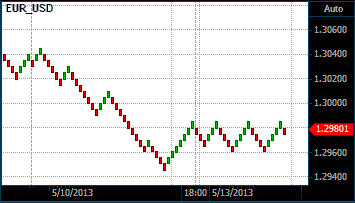
The high and low of a time period is ignored in Renko charts, and while the close price is used to determine the amount and direction of the bricks to be drawn, the actual close price is not as important as the top or bottom of the last brick. The following chart is a 30-minute candlestick chart of the EUR/USD followed by a comparative Renko chart of the same time period. The Renko chart has a point size of 50 points (5 pips) and the arrow on the two charts corresponds with the same price.

A Candlestick chart of the Euro/USD
A Renko chart of the Euro/USD
Setting the Point Size
Although the example above used absolute points for the predetermined point or brick size, you can also use the Average True Range (ATR) to set the point size more dynamically, increasing and decreasing the brick size as the market volatility increases or decreases.
Trading the Renko Chart
The Renko Chart is a trend following chart that eliminates lateral price movements. It's main signals are the emergence of a new trend. In theory this occurs when a bullish hollow brick is followed by a bearish black brick it signifies the potential start of a down trend and signals a short entry; and when a bearish black brick is followed by a bullish hollow brick it signifies the potential start of a uptrend and signals a long entry. However, in practice a number of bricks could be drawn to represent the price movement of a single time period and you can only draw the next brick or bricks once you know what the close price is for that period. This means that the actual entry signals are not necessarily the first brick of a different color to its predecessor.