Fibonacci Price Retracements
What is it?
Fibonacci price retracements is a support and resistance indicator that is used to determine possible support and resistance levels. Like Fibonacci fans, Fibonacci Retracements levels based on the mathematical relationships, expressed as ratios, between the numbers in the Fibonacci summation series.
The Fibonacci summation series of numbers is simply the sum of the two preceding numbers starting with 0 and 1, and continues on to infinitely. The first few numbers in the sequence are as follows: 0, 1, 1, 2, 3, 5, 8, 13, 21, 34, 55, 89, 144, etc. Fibonacci retracements is based on the common mathematical relationships or ratios between these numbers.
How is it calculated?
The key Fibonacci retracement levels are found by performing various mathematical operations on the numbers in the Fibonacci summation series, and on the results of those operations.
- The first ratio of 61.8%, which is the inverse of "golden ratio" or the "golden mean" (i.e., the inverse of 1.61%), is found by dividing a number in the sequence by the number that follows it. For example: 8 ÷ 13 = 0.6153, 34 ÷ 55 = 0.6182 and 55 ÷ 89 = 0.6179.
- The 38.2% ratio is found by dividing a number in the sequence by the number that appears two places to the right of it. For example: 8 ÷ 21 = 0.3809, 21 ÷ 55 = 0.3818 and 55 ÷ 144 = 0.3819. It is also found by subtracting 0.618 from 1 (1 – 0.618 = 0.328) and by finding the square of 0.618 (0.618 x 0.618 = 0.382).
- The 23.6% ratio is found by dividing a number in the sequence by the number that appears three places to the right of it. For example: 8 ÷ 34 = 0.2352, 21 ÷ 89 = 0.2359 and 34 ÷ 144 = 0.2361. It is also found by subtracting 0.382 from 0.618 (0.618 – 0.382 = 0.236) and by multiplying ratio 0.382 by 0.618 (0.382 x 0.618 = 0.236).
- The ratio of 78.6% is found by finding the square root of 61.8%. Some traders prefer to use the ratio of 76.4% which is found by subtracting 0.236 from 1.00 (1.00 – 0.236 = 0.764).
- In addition to these four ratios, the 0% and 100% retracement levels are also use to mark the start of the retracement and a full retracement of the previous move, and the 50% retracement level is used to mark the mid-point between the swing high and the swing low of the wave. The 50.0% level is not a Fibonacci ratio, per se, but is a point of interest on the charts that the retracement adheres to from time to time.
How is it used?
Fibonacci retracement is based on the idea that markets will retrace a predictable portion of the previous movement before price action resumes in the direction of the larger trend. This is based on the fact that the financial markets do not trend in a straight line. Instead the trend is interrupted by retracements that tend not to exceed the previous wave.
When using Fibonacci retracements, a technical analyst waits for the market to turn and then divides the previous trend movement, or wave, by the Fibonacci retracement ratios, starting from the previous high to the low in an uptrend and in the opposite direction in a down trend. Horizontal lines are then drawn at these levels and are used a possible support levels if the larger trend is an uptrend, or as possible resistance levels if the larger trend is a down trend. These thus become places at which the trader could buy in a larger uptrend or sell in a larger down trend. The most significant levels are usually the 61.8% level and the 38.2% level. The 23.6% level and the 78.6% (or 76.4%) levels are not as significant.
Multiple Fibonacci retracement studies can also be drawn starting from different peaks in a down trend or different lows in an uptrend. The end points for the different retracements are the same most recent turning point. This creates multiple levels with areas were two or more retracement levels are in close proximity being more significant. It is important that the end point for multiple retracements studies have the same, most recent swing high or swing low as their end points.
Unlike support and resistance lines, old Fibonacci retracement levels do not retain significance once broken. They do not change from support levels to resistance levels once the previous high or low has been broken. When the previous high or low has been broke, new Fibonacci retracements should be drawn once the next swing high or swing low has been formed.
Chart Example
The following is a 4-hour chart of the Euro/USD with Fibonacci Retracements drawn from significant high and lows made on May 14, 2013 and May 15, 2013 respectively. Notice how the subsequent reaction rally met resistance at the 38.2% retracement level before moving lower.
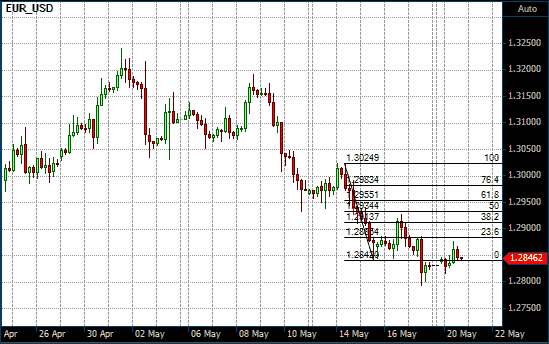
Fibonacci Retracements on a 4 Hour Euro/USD chart