Up Gap Side-By-Side White Lines Pattern
What is the Up Gap Side-By-Side White Lines Pattern?
The Up Gap Side-By-Side
White Lines Pattern
The Up Gap Side-By-Side White Lines candlestick pattern is a triple candlestick pattern that is the bullish counterpart of the Down Gap Side-By-Side White Lines candlestick pattern. Both the Down Gap Side-By-Side White Lines candlestick pattern and the Up Gap Side-By-Side White Lines pattern are a moderate trend continuation patterns. As the Up Gap Side-By-Side White Lines pattern is a bullish trend continuation pattern, is should only be taken into consideration if it appears in an established uptrend.
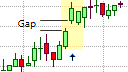
The Up Gap Side-By-Side White Lines Formation
The Up Gap Side-By-Side White Lines pattern consists of three candlesticks of which the first candlestick is a bullish candlestick that is supportive of the current uptrend. This candlestick is followed by second candlestick that gaps up on open from the real body of the previous candlestick, which is also supportive of the uptrend and closes higher than its open and is thus also light in color. The second candlestick is followed by another light-colored candlestick of a similar size. This last candlestick gaps down from the close of the previous candlestick but closes higher. This creates an overlap between the real bodies of the last two candlesticks in the pattern, giving it the "side-by-side white lines" nomenclature.
What the Up Gap Side-By-Side White Lines Pattern tells us
The Up Gap Side-By-Side White Lines pattern is illustrative of the bullish market sentiment. The first candlestick is supportive of the uptrend, with the gap up on open of the second candlestick also very supportive of the uptrend. However, the gap down on open of the last candlestick is illustrative of the bears' ultimately unsuccessful attempt to wrestle control of the market. Their attempt to control the market is unsuccessful as the last candlestick closes higher than its open. This indicates that the bulls still control the market and the current uptrend is more likely to continue rather than the bears taking control and reversing the direction of the market.
Trading the Up Gap Side-By-Side White Lines
The Up Gap Side-By-Side White Lines pattern is a bullish continuation pattern that appears in an uptrend and suggests that the uptrend is more likely to continue than reverse. Traders that have existing long positions would want to hold their long positions, and possibly add to it. Traders that missed earlier opportunities to enter the market could use the Up Gap Side-By-Side White Lines pattern to enter the market on the long side. A long position could be initiated when an upside break above the high of the formation occurs. A protective stop order could be placed below the lowest low of the candlesticks in the pattern. If the protective stop-loss is too far from the entry to provide a favorable risk/reward ratio, the trader could wait for a possible retracement back towards the low of the last two candlesticks in the Up Gap Side-By-Side White Lines pattern. This would place the entry much closer to the protective stop and would reduce the capital at risk on the trade, though there is no guarantee that a retracement will take place.
The Up Gap Side-By-Side White Lines pattern does not provide a clear profit target; therefore, other trading mechanisms or methods, such as a previous support or resistance area, a measured moved defined by an acceptable risk/reward ratio, a key Fibonacci extension level, the appearance of a bearish candlestick formation, or a simple trailing stop.
The Up Gap Side-By-Side White Lines pattern becomes more reliable when it appears at a lower trend line or a support line. An Up Gap Side-By-Side White Lines pattern that forms at or near a lower trendline or a support line can be used in anticipation that the test of the trendline or support line will hold. As a result, the price should be expected to climb, giving greater impetus to the pattern.