The Piercing Line Candlestick Pattern
What is the Piercing Line Pattern?
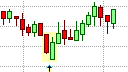
The Piercing Line Pattern
The Piercing Line candlestick pattern is known in Japanese as kirikomi, which means 'cutback' or 'switchback'. It is a double candlestick pattern that warns of a possible bullish trend reversal, making it a bottom reversal pattern that appears towards the end of a downtrend. The Piercing Line pattern is the opposite of the bearish Dark Cloud Cover pattern that appears in an uptrend. As the Piercing Line pattern is a bullish trend reversal pattern, it must appear in an existing down trend for pattern to be of any significance.
The Piercing Line pattern is also related to the On-Neck pattern, the In-Neck pattern, and the Trusting Line pattern that are all bullish double candlestick patterns that have the same general formation but differ by the extent that the second candlestick penetrates the previous candlestick.
The Piercing Line Formation
The Piercing Line pattern consists of two candlesticks with alternating colors. The first candlestick must be supportive of the current downtrend. Thus, it must be a black or dark-colored candlestick with a large real body. The second candlestick then gaps down and away from the real body of the previous candlestick to open below the low of the previous candlestick. This candlestick then reverses direction, becoming a bullish candlestick that closes above the mid-point of the previous candlestick's real body. If the second candlestick fails to penetrate above the mid-point of the previous candlestick's real body, then the formation becomes a Trusting Line pattern.
What the Piercing Line Pattern tells us
The first candlestick in the Piercing Line pattern is strong, bearish candlestick that indicates that the on-going sell off is still going strong. The second candlestick then gap down at the open to below the real body the previous candlestick, reinforcing the notion that the downtrend is still strong. However, this candlestick then reverses direction and close well into the real body of the first candlestick indicating a marked weakness in the trend as the bearishness has dissipated quite quickly. As a result, a change in trend and a possible reversal can be expected.
The deeper the white candlestick pierces the real body of the first candlestick, the more significant the pattern becomes. The pattern also becomes more significant if the two candlesticks that form the pattern are Marubozu candlesticks with no upper or lower shadows.
Trading the Piercing Line Pattern
The Piercing Line pattern is a bullish trend reversal pattern that indicates that there is weakness in the current downtrend, with the implication that the downtrend may be coming to an end. Traders would, therefore, look to go long (buy) once the Piercing Line formation has completed. An aggressive trader would take a long position on the open of the following candlestick with a protective stop order placed just below the low of the Piercing Line pattern. Traders that are holding open short positions would also want to exit their short positions at this stage as holding on to short positions for longer would be risky.
More conservative traders would wait for the following candlestick to confirm the reversal before taking a long position. This confirmation would be in the form of the next candlestick closing higher than the second candlestick in the pattern. Here, a protective stop order should again be placed just below the low of the Piercing Line pattern as a break below the Piercing Line formation would invalidate the pattern. If the protective stop loss is too far from the entry of the trade, the trader could wait for a pull-back towards the potential support area of the Piercing Line pattern's low before opening a long position. This would place the entry much closer to the protective stop and would reduce the capital at risk on the trade.
The Piercing Line pattern does not provide a clear profit target but previous levels of support or previous area of consolidation could be used as an initial price target. A trader could also implement a profit target based on a defined risk/reward ratio, a measured move, or some other trading mechanism can be used to exit the trade. This could be a Fibonacci retracement level, the appearance of a bearish candlestick formation, or a simple trailing stop.
As with most trend reversal patterns, the Piercing Line pattern becomes more reliable depending on where it appears on the price chart in relation to trend lines, pivot points, and support and resistance lines, etc. Furthermore, traders can use the Piercing Line pattern in conjunction with an oscillating indicator, such as the RSI, that shows the security to be oversold.