The Harami and Harami Cross Patterns
What is the Harami Pattern?
Bullish and Bearish Harami Pattern
The Harami is a two-candlestick trend reversal pattern that is quite similar to the western Inside Day pattern that appears in OHLC charts. It is also the inverse of the Engulfing pattern in formation.
The name of the pattern, harami is derived from the Japanese word for pregnant, with the first candlestick in the pattern referred to as the mother as it contains or engulfs the second, much smaller candlestick, creating the appearance of a pregnant mother.
The pattern can be a bullish Harami pattern if it appears at the end of a downtrend, or it can be a bearish Harami pattern if it appears at the top of an uptrend.
The second candlestick in the Harami formation may take the form of a Spinning Top or a Doji. When the second candlestick is a Doji, the pattern is called a Harami Cross, which is a much more significant signal than the regular Harami pattern.
The Harami Formation
The Harami pattern should appear in an existing trend for it to be taken into consideration. It consists of two candlesticks with the first candlestick being a relatively large candlestick and the second candlestick being a relatively small candlestick. The first candlestick should be supportive of the current trend. The second candlestick in the pattern should open and close within the real body of the first candlestick, making it a small candlestick whose real body is completely enclosed by the real body of the first candlestick. Given the size of the second candlestick in the pattern, the color of its real body is not important.
The Bullish Harami Formation
The bullish Harami formation is similar to the Homing Pigeon formation. It consists of two candlesticks that can appear near the end of an existing downtrend. The first candlestick in the pattern is a relatively large candlestick and the second candlestick is a relatively small candlestick. The first candlestick should be a long, dark-colored candlestick that is supportive of the current downtrend. This is followed by a second candlestick that opens above the close of the first candlestick and also closes within the real body of the first candlestick, making it a small candlestick whose real body is completely enclosed by the real body of the first candlestick. The color of the second candlestick is not important, though it would be a light-colored candlestick more often than not.
What the Bullish Harami Pattern tells us
The first candlestick in the bullish Harami pattern indicates that the downtrend is still strong with the length of its real body illustrative of the extent of that strength. However, the second candlestick opens bullishly, against the downtrend and has a much smaller real body that does not exceed the length of the first candlestick's real body. This candlestick shows weakness in the trend, in sharp contrast to the strength shown in the first candlestick. It also conveys a sense of indecision in the market with the market not moving significantly in either direction. This gives bears that entered on the first candlestick reason to be concerned, creating conditions that are fertile for a trend reversal.
Trading the Bullish Harami Pattern
The bullish Harami pattern is a moderate trend reversal pattern and should be followed by a candlestick that confirms the trend reversal before being acted upon, though it can also be used to exit an existing short position without requiring confirmation. This confirmation could be, at the least, a close above the high of the first candlestick. Once confirmation has been obtained the trader would look to go long with a protective stop placed below the low of the first candlestick. If the protective stop loss is too far from the entry of the trade, the trader could wait for a pull-back towards the potential support area of the Harami pattern's low before opening a long position. This would place the entry much closer to the protective stop and would reduce the capital at risk on the trade. There is, however, no guarantee that a pull-back will occur.
The bullish Harami pattern, like most candlestick patterns, does not provide a profit target for the trade. Instead, a trader could implement a profit target based on a defined risk/reward ratio, a measured move, or use a trailing stop to exit the long position.
If the Harami appears at or near a support line, or a trend line, it becomes more significant. Also, the smaller the real body of the second candlestick, the more significant the pattern becomes.
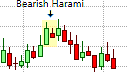
The Bearish Harami Formation
The bearish Harami pattern is the opposite of the bullish Harami pattern and must appear near the top of an existing uptrend. Here the first candlestick should be a long, light-colored candlestick that is supportive of the uptrend. This is followed by a second candlestick that opens and closes within the real body of the first candlestick, making it a small candlestick that is enclosed by the real body of the first candlestick. The color of the second candlestick is also not important, though more often than not it will be a bearish, dark-colored candlestick.
What the Bearish Harami Pattern tells us
As with the bullish Harami pattern, first candlestick in the bearish Harami pattern indicates that the uptrend is still strong with the length of its real body illustrative of the extent of that strength. However, the second candlestick opens against the uptrend and has a much smaller real body that also does not exceed the length of the first candlestick's real body. This candlestick shows weakness in the trend, in sharp contrast to the first candlestick. It also conveys a sense of indecision in the market with the market not moving significantly in either direction.
Trading the Bearish Harami Pattern
The bearish Harami pattern is a moderate trend reversal pattern and should be followed by a candlestick that confirms the trend reversal before being acted upon, though it can also be used to exit an existing long position without requiring confirmation. Once confirmation has been obtained the trader would look to short the market with a protective stop above the high of the Harami formation.
As with the bullish Harami pattern, the bearish Harami pattern does not provide a profit target for the trade. Instead, a trader could implement a profit target based on a defined risk/reward ratio, a measured move, or some other trading mechanism can be used to exit the trade. This could be a Fibonacci retracement level, the appearance of a bullish candlestick formation, or a simple trailing stop.
The smaller the real body of the second candlestick, the more significant the pattern becomes. Also, if the Harami appears at an all-time high, or near a resistance line, or a trend line, it becomes more significant.
The Harami Cross
The Harami Cross pattern is more significant as it contains a Doji, which is a candlestick with no or very little real body. A Doji is formed when the open price and the close price of the candlestick are the very same level, or are very close together. They tend to indicate indecision and uncertainty in the market. They also indicate that the market is momentarily in a state of equilibrium with neither the bears nor the bulls having the strength to move the market significantly in either direction. Also, a Doji with long the shadows has the greater the significance than a Doji with short shadows.