Windows or Gaps
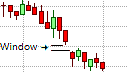
A Falling Window
In Japanese candlestick patterns, an area where no transactions occurred between two consecutive candlesticks is referred to as a window. A window is referred to as a gap in Western terminology. It is an area on the chart where there were no transactions occurred between the price extremes of the previous candlestick and the price extremes of the current candlestick. In other words, if there is a gap between high of the previous candlestick and the low of the following candlestick or vice versa where no price activity occurred, it is referred to as a window. A window that occurs in a downtrend is referred to as a falling windows, while a window that forms in an uptrend is referred to as a rising window.
The significance of a window
In Japanese candlestick charts, windows are usually associated with a continuation of the trend as it indicates the extent of the demand for the underlying security. The bigger the window, the more significant it is, though it is not unusual for a bearish candlestick to appear immediately after the window as a windows is often followed by a short period of consolidation or correction as traders take quick profits. In the consolidating or correction phase the window becomes support in uptrend, or resistance in a downtrend with the consolidation or correction considered completed once the open window has been tested and ultimately closed. In Western parlance, closing the window is referred to as filling the gap. Once the window has been closed in an established trend, the prevailing trend could be expected to continue. If the window is closed, but the price does not rebound, in other words, the support or resistance offered by the windows is broken, the prevailing trend is considered to have ended. This does not imply that a reversal will occur.
There are several candlestick continuation patterns that have windows as part of their formation. These candlestick patterns include the Tasuki pattern, the Up-Gap Side-by-Side White Lines, and the Down-Gap Side-by-Side White Lines.
Reversal Windows
Windows do not always appear in the direction of the trend. At times a falling window will appear in an uptrend below the lower shadow of the previous candlestick. This falling window has bearish implications, especially when the previous candlestick was an indecisive Doji, or if the previous candlestick formed part of a trend reversal signal, such as a Hanging Man or Shooting Star. In this instance, the previous candlestick warns that the current uptrend is weakening and the falling window confirms that the trend has ended. Though there is still a possibility that the window will be closed before the price action reverses. Windows that open against the trend are rare but are often much more significant than the windows that appear in the direction of the trend.