The Thrusting Line Candlestick Pattern
What is the Thrusting Line Pattern?
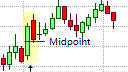
The Thrusting Line Pattern
The Thrusting Line candlestick pattern a double candlestick pattern that is similar to the In-Neck pattern and the On Neck pattern, which are all underdeveloped variations of the Piercing Line pattern. The major difference between the Thrusting Line pattern and the other related patterns is that the second candlestick in the Thrusting Line pattern must close at or near the midpoint of the real body of the candlestick that preceded it. Of these patterns, only the Piercing Line pattern is classified as a trend reversal pattern. The In-Neck, On-Neck and Thrusting Line patterns are all classified as bearish trend continuation patterns that can appear in an established downtrend.
The Thrusting Line Formation
The Thrusting Line pattern is a bearish trend continuation pattern and should only be taken into consideration if it appears in an established downtrend. The first candlestick in the pattern should be a relatively large, bearish candlestick with a large real body that is supportive of the downtrend. The second candlestick in the pattern should gap down from the real body of the previous candlestick on open but then turns bullish and closes near or at the midpoint of the previous candlestick's real body. Should the second candlestick close above the midpoint of the first candlestick's real body, it would become a Piercing Line pattern, which is a bullish trend reversal pattern.
What the Thrusting Line Pattern tells us
The Thrusting Line pattern could appear in an established downtrend where the bears are in control of the market. This control continues on the first candlestick in the Thrusting Line pattern that is a relatively large candlestick with a large real body. The size of this candlestick illustrates the existing strength of the bears in maintaining the downtrend. The second candlestick, however, represents a challenge for the bears as it is a bullish candlestick. However, the bulls fail to penetrate beyond the midpoint of the real body of the first candlestick in the pattern. The bears have succeeded in fending off the bulls and a resumption of the downtrend could be expected. Had the bulls managed to penetrate beyond the midpoint of the first candlestick, a bullish trend reversal would have been more probable.
Trading the Thrusting Line Pattern
The Thrusting Line pattern is a bearish trend continuation pattern and represents an opportunity for the trader to enter a short position, or to add to an existing short position. However, a sell order to open a short position should only be places once the pattern has been confirmed. Confirmation of the Thrusting Line pattern could be in the form of a close below the low of the second candlestick in the pattern. When entering a new position, a protective stop-loss should be placed just above the high of the first candlestick in the pattern as a price movement above the pattern indicates that the correction might be extended or that there is deeper weakness in the downtrend, making a transition to a bullish reversal a possibility.
The Thrusting Line pattern also represents an opportunity for a trader that has an open (existing) short position to move their protective stop-loss to just above the high of the first candlestick and potentially lock in some profits.
As with most other trend continuation patterns, the Thrusting Line pattern becomes more reliable if it at an upper trend line or a resistance line on the price chart, where it could indicate that these levels have held. Traders can use the Thrusting Line pattern in conjunction with an oscillating indicator, such as the RSI.