Down Gap Side-By-Side White Lines Pattern
What is the Down Gap Side-By-Side White Lines Pattern?
Down Gap Side-By-Side
White Lines Pattern
The Down Gap Side-By-Side White Lines pattern is the bearish version of the Up Gap Side-By-Side White Lines pattern. Like the Up Gap Side-By-Side White Lines pattern, the Down Gap Side-By-Side White Lines pattern is a trend continuation pattern with a moderate success rate. However, the nature of Down Gap Side-By-Side White Lines formation makes it a very rare continuation candlestick pattern. The Down Gap Side-By-Side White Lines must appear in an established downtrend before it is taken into consideration and even then, with its moderate success rate, trading this pattern requires a fair amount of caution.
The Down Gap Side-By-Side White Lines Formation
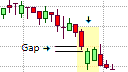
The Down Gap Side-By-Side White Lines pattern consists of three candlesticks of which the first candlestick is a bearish candlestick that is supportive of the underlying downtrend and is dark in color. This candlestick is followed by second candlestick that gaps down on open from the real body of the previous candlestick. It may overlap the lower shadow or wick of the previous candlestick. The second candlestick turns bullish and closes higher than its open and is thus light in color. The second candlestick is followed by another light-colored candlestick of a similar size that also gaps down on open but closes higher. The overlap between the real bodies of the two last candlesticks in the pattern gives it the 'side-by-side white lines' name.
What the Down Gap Side-By-Side White Lines Pattern tells us
The reason that the down gap side-by-side white line pattern is so rare is because a gap down in a downtrend in quite bearish, with the gap down indicating the strength of the bearish nature of the market. It is unusual for bears to surrender control and allow the bulls to close the candlestick higher, resulting in a light-colored candlestick that gapped down.
The first candlestick is supportive of the downtrend, with the gap down on open of the second candlestick also supportive of the downtrend. However, the bullish close of the second candlestick is a threat to the bears, with weaker bears closing out their positions and locking in their profits. The latter represents a correction rather than a reversal and continues on the last candlestick in the pattern that also gaps down on open but closes higher. However, the market is more likely to continue with its bearish sentiment or start moving sideways rather than reverse direction.
Trading the Down Gap Side-By-Side White Lines
The Down Gap Side-By-Side White Lines pattern is a bearish continuation pattern that appears in a downtrend and suggests that the trend will probably continue after the pattern has completed. Traders that have existing short positions would want to hold on their short positions, and possibly add to it. For traders that missed earlier opportunities to enter the market, the bearish Down Gap Side-By-Side White Lines pattern represents an opportunity to enter the market. A short position could be initiated when a downside break below the low of the formation occurs. A protective stop order could be placed above the highest high of the candlesticks in the pattern. If the protective stop-loss is too far from the entry to provide a favorable risk/reward ratio, the trader could wait for a possible pull-back towards the high of the last two candlesticks in the Down Gap Side-By-Side White Lines pattern. This would place the entry much closer to the protective stop and would reduce the capital at risk on the trade, though there is no guarantee that a retracement will take place.
The Down Gap Side-By-Side White Lines pattern also does not provide a clear profit target; therefore, other trading mechanisms or methods, such as a previous support or resistance area, a measured moved defined by an acceptable risk/reward ratio, a key Fibonacci extension level, the appearance of a bullish candlestick formation, or a simple trailing stop.
The Down Gap Side-By-Side White Lines pattern becomes more reliable when it appears at an upper trend line or a resistance line. A Down Gap Side-By-Side White Lines pattern that forms at or near an upper trendline or a resistance line can be used in anticipation that the test of the trendline or resistance line will hold. As a result, the price should be expected to bounce off (down) the trendline or resistance line, giving greater impetus to the bearish pattern.