The Abandoned Baby Candlestick Pattern
What is the Abandoned Baby Pattern?
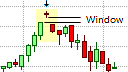
The Abandoned Baby Pattern
The Abandoned Baby pattern is a rare major triple candlestick reversal pattern that can appear in a uptrend, where it becomes an Abandoned Baby Top with bearish implications, or in a downtrend, where it becomes an Abandoned Baby Bottom with bullish implications. The Abandoned Baby Top and Abandoned Baby Bottom are more specific versions of the Evening Star and Morning Star patterns, respectively. The Abandoned Baby 's specificity relates to the gap or window that must exist between the middle candlestick that forms the Star, including its shadows, and the other candlesticks on either side of it; and the Star must be a small Doji. It is also similar to the Island Top or Island Bottom pattern in Western charting.
The Abandoned Baby Formation
The Abandoned Baby consists of three candlesticks that can appear in an existing trend for it to be of significance. The second, or middle candlestick in the pattern is a small Doji that gaps away completely from the first candlestick, including its shadows. The first candlestick in the Abandoned Baby must be a relatively large candlestick that is supportive of the current trend. This candlestick is followed by a small Doji that gaps away, in the direction of the trend, from the first candlestick leaving a window between the shadows of the previous and those of the Doji.
The Abandoned Baby Top Formation
The Abandoned Baby Top is a major bearish trend reversal pattern that must appear in an uptrend. It consists of three candlesticks, with the middle candlestick being a small Doji that gaps away completely from the first candlestick. Note that the gap must exist between the shadows or wicks as well; otherwise, it is an Evening Star rather than an Abandoned Baby pattern. The first candlestick in the Abandoned Baby Top must be supportive of the uptrend and must therefore be light in color and have a relatively large real body. The candlestick that follows this relatively large, light-colored candlestick must be a small Doji that gaps away from the first candlestick leaving a clear window between the upper shadow of the previous, large candlestick and the lower shadow of the Doji. In other words, the Doji cannot form within the upper shadow of the previous candlestick but must gap away from it completely. There must also be a gap or a window between the Doji and the candlestick that follows the Doji, including a gap between their shadows.
What the Abandoned Baby Top tells us
The Doji that appears in the Abandoned Baby Top pattern is the first indication of weakness in the current uptrend when the forces of the bulls and the bears have become more balanced and neither the bullish buyers nor the bearish sellers were able to move the price significantly in their favor. This is a marked contrast to the previous candlestick which indicated that the bulls were firmly in control of the market! This weakness in the current trend and the momentary balance of the market forces is quickly tipped in the favor of the bearish sellers on the third candlestick, which moves against the uptrend and is therefore a dark candlestick that closes well into the body of the first candlestick. The bears have begun to take control and their show of strength would be even greater if they manage to close the last candlestick below the low of the first candlestick! If not, confirmation of this change in sentiment should come on the next candlestick, which would be expected to break below the low of the Abandoned Baby Top pattern.
Trading the Abandoned Baby Top
The Abandoned Baby Top forewarns of weakness in the uptrend and a possible transition to a trend reversal. This implies that the bullish uptrend coming to an end is more likely than it continuing. Traders with open long positions should, therefore, look the exit their positions on the opening of the next candlestick.
Traders would now be anticipating the emergence of a downtrend and will be looking to be short, which means they will be preparing to place sell orders. If the last candlestick in the Abandoned Baby formation closes lower than the first candlestick, the trader may initiate a short position on the opening of the next candlestick, especially if the last candlestick in the formation is shaven at the bottom, i.e., it closes at its low price. If, however, the first candlestick is the lowest in the formation, a trader should wait for confirmation of the pattern before placing a sell order. This confirmation would be a price break below the low of the pattern. Therefore, the trader could place a sell order just below the low of the pattern to take a short position in the market.
Since a short position would be taken against the current trend, a protective stop-loss order should be used to limit the risk of the pattern failing. This protective stop could be placed just above the top of the Doji in the middle of this candlestick formation. A price break above this level would negate the pattern; it would violate the potential resistance area represented by the up gap on either side of the Doji in the middle, and would be making a higher high, which is considered bullish. Thus, the area just above the Doji in this pattern would be an ideal location to place a protective stop-loss.
However, if the placement of the protective stop-loss is too far from the entry to provide a favorable risk/reward ratio, the trader could wait for a possible pull-back towards the potential resistance area represented by up gap below the Doji before entering the trade. This would place the entry much closer to the protective stop and would reduce the capital at risk on the trade, though there is no guarantee that a pull-back will occur. Remember that confirmation of the pattern must first be obtained before placing a sell order.
The Abandoned Baby pattern does not provide a clear profit target. Instead, a trader could implement a profit target based on a defined risk/reward ratio, a measured move, or some other trading mechanism can be used to exit the trade. This could be a Fibonacci retracement level, the appearance of a bullish candlestick formation, or a simple trailing stop.
As with most trend reversal patterns, the Abandoned Baby pattern becomes more reliable depending on where it appears on the price chart in relation to trend lines, pivot points, and support and resistance lines, etc. An Abandoned Baby pattern at or near an upper trendline or resistance line can be used in anticipation that the test of the trendline or resistance line is not likely to break it. The resulting price decline following the failure to break the trendline or resistance line should give greater impetus to the pattern. Also, if the Abandoned Baby Top pattern is formed at an all-time high, it becomes more significant as the market could be overbought. Here traders can use the Abandoned Baby Top pattern in conjunction with an oscillating indicator, such as the RSI, that shows the security to be overbought.
The Abandoned Baby Bottom Formation
The Abandoned Baby Bottom is the bullish counterpart of the Abandoned Baby Top that must appear in a downtrend. The first candlestick in the Abandoned Baby Bottom pattern must be in the direction of the downtrend and must therefore be black or dark in color. It must also have a large real body relative to the candlesticks that preceded it. This bearish candlestick is followed by the Doji that gaps away from the first candlestick leaving a window between the lower shadow of the first candlestick in the pattern, and the upper shadow of the Doji. There must also be a gap or a window between the Doji and the third candlestick in the formation.
What the Abandoned Baby Bottom tells us
As with the Abandoned Baby Top, the Doji is the first indication of weakness in the current downtrend. It represents a period of indecision in the market with the price not moving significantly in either direction. This weakness is confirmed by the third candlestick which must move against the downtrend and, hence, must be a light in color and must close well into the body of the first candlestick. This indicates that the bulls have taken control and a reversal of the trend!
Trading the Abandoned Baby Bottom
Trading the Abandoned Baby Bottom is the inverse of trading the Abandoned Baby Top. Here weakness in an existing downtrend and the probable end of that downtrend is implied. Traders with open short positions should be looking to cover their short positions on the open of the candlestick that follows the Abandoned Baby Bottom formation.
Traders should now be anticipating the transition to an uptrend and will be looking to go long, which means they will be preparing to place buy orders. If the last candlestick in the Abandoned Baby formation closes higher than the first candlestick, the trader may initiate a long position on the opening of the next candlestick, especially if the last candlestick in the formation has a shaven top, i.e., its high price is also its close price. If, however, the first candlestick has the highest high in the formation, a trader should wait for confirmation of the pattern before placing a buy order. This confirmation would be a price break above the high of the pattern. Therefore, the trader could place a buy order just above the high of the pattern.
As a long position would be taken against the current downtrend, a protective stop-loss order should be used to limit the risk of the pattern failing. This protective stop could be placed just below the low of the Doji that is the middle candlestick in the Abandoned Baby Bottom formation. A price break below this level would negate the pattern; it would violate the potential support area represented by the down gap on either side of the Doji, and would be making a lower low, which would have bearish implications. Thus, the price area just below the Doji in this pattern would be an ideal location for a protective stop.
If the protective stop-loss is too far from the entry to provide a favorable risk/reward ratio, the trader could wait for a possible retracement back towards the potential support area represented by up gap below the Doji before entering the trade. This would place the entry much closer to the protective stop and would reduce the capital at risk on the trade, though there is no guarantee that a retracement will take place. Remember that confirmation of the pattern must still be obtained before a buy order is placed.
The Abandoned Baby pattern also does not provide a profit target but a trader could implement a profit target based on a measured moved defined by an acceptable risk/reward ratio or some other trading mechanism can be used to exit the trade. This could be a Fibonacci retracement level, the appearance of a bearish candlestick formation, or a simple trailing stop.
The Abandoned Baby Bottom becomes more reliable depending on where it appears on the price chart in relation to trend lines, pivot points, and support and resistance lines, etc. An Abandoned Baby Bottom that forms at or near a lower trendline or a support line can be used in anticipation that the test of the trendline or support line is not likely to break it. As a result, the price should be expected to climb, giving greater impetus to the pattern. Also, if the Abandoned Baby Bottom pattern is formed at a low-price level or in an extended downtrend, it becomes more significant as the market could be in an oversold condition. Here traders can use the Abandoned Baby Bottom pattern in conjunction with an oscillating indicator, such as the RSI, to confirm that the security is oversold.
As always, disciplined money management should be exercised when trading the market.