Point and Figure Charts
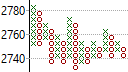
A Point & Figure Chart
Point and Figure (P&F) charts date back to at least 1880's and differ from other stock charts as it does not plot price movement from left to right within fixed time intervals. It also does not plot the volume traded. Instead it plots unidirectional price movements in one vertical column and moves to the next column when the price changes direction. It represent increases in price by plotting X's in the column and decreases in price by plotting O's. Each X and O represents a box of a set size or price amount. This box size determines how far the price must move before another X or O is added to the chart, depending on the direction of the price movement. Thus if the box size is set at 15, the price must move 15 points above the previous box before the next X or O is plotted. Any movement below 15 is ignored. For this reason, very little plotting occurs during stagnant market conditions while a considerable amount of plotting may occur during volatile market conditions.
The chart also has a box reversal amount that determines how many boxes must occur in the opposite direction before it is seen as a reversal. Only once the price is seen as having reversed is a new column started. In a 3 box reversal requires the price to move three boxes (of 45 points if each box represents 15 points) against the current direction before it is seen as a reversal.
Some traders argue that P&F charts are one of the best charting techniques for accurately determining entry and exit signals as they present a clear indication of support and resistance lines, as well as clear trend lines. P&F charts also trace its own set of chart patterns, such as the fulcrum, the saucer, and the V base.