Line Charts
A Typical Line Chart
A line chart is the most basic and simplest type of stock charts that are used in technical analysis. The line chart is also called a close-only chart as it plots the closing price of the underlying security, with a line connecting the dots formed by the close price. In a line chart the price data for the underlying security is plotted on a graph with the time plotted from left to right along the horizontal axis, or the x-axis and price levels plotted from the bottom up along the vertical axis, or the y-axis. The price data used in line charts is usually the close price of the underlying security. The uncluttered simplicity of the line chart is its greatest strength as it provides a clean, easily recognizable, visual display of the price movement. This makes it an ideal tool for use in identifying the dominant support and resistance levels, trend lines, and certain chart patterns.
However, the line chart does not indicate the highs and lows and, hence, they do not indicate the price range for the session. Despite this, line charts were the charting technique favored by Charles Dow who was only interested in the level at which the price closed. This, Dow felt, is the most important price data of the session or trading period as it determined that period's unrealized profit or loss.
Line charts or close-only charts are still favored by numerous traders who agree the closing price is the most important data and are not concerned with the noise created price spikes and minor price movements, or the speculation that characterizes the start of the trading session.
The following is a chart of the EUR/USD with a 15-minute time frame.
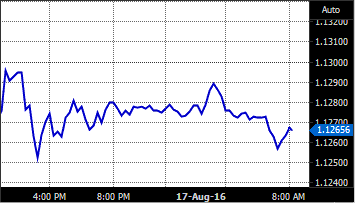
A Line chart of the Euro/USD