Kagi Charts
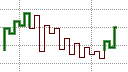
A Kagi Chart
Kagi charts originated in Japan, in the 1870s, where they were developed to track the price movement of rice. They are similar to Point and Figure charts and Renko charts in that they are time independent and only move when the closing price of the underlying security has advanced or declined by a predetermined amount. In the case of Kagi charts, an equal length vertical line segment is drawn for every the multiple of the predetermined amount that the price closes during a specified time period. If the price does not move by at least the predetermined amount, no line segment is drawn and if the price does reverse by the predetermine amount, a short horizontal line is drawn to the next column and a line in the new direction is drawn. The horizontal line that joins a rising line to a declining line is called a "shoulder" and the horizontal line that joins a declining line to a rising line is called a "waist".
When the line in the opposite direction moves beyond the shoulder or waist, i.e., when it exceeds the length of the line in the previous column, it changes in thickness, denoting a reversal in the direction of the trend. Thus, when a downward line moves beyond the previous wait, it becomes a thin line called a yin line; and when an upward moving line moves beyond the previous shoulder, it becomes a thick line called a yang line. A thick yang line denotes a bullish uptrend while a thin yin line denotes a bearish down trend. This change from yin to yang and from yang to yin is used to generate trading signals.
The reversal amount that is used to construct a Kagi chart can be specified using absolute points, a fixed percentage, or the Average True Range (ATR).
Support and resistance lines, trend lines and other chart pattern analysis techniques can also be applied to Kagi charts.