On Balance Volume (OBV)
What is it?
On Balance Volume (OBV) is a market strength indicator that was developed by Joe Granville and introduced in his book: New Key to Stock Market Profits in 1963. The OBV is a leading indicator that is used to determine positive and negative volume flow for a given security by comparing volume to price movements. It is a simple indicator that adds a time-frame's volume when the closing price is up and subtracts the time-frame's volume when the closing price is down. The OBV line is a running cumulative total of this volume. The time-frame can be monthly, weekly, weekly, hour, 15 minutes, etc.
How is it calculated?
As already stated, OBV is calculated by adding the time-frame's volume to a running cumulative total when the security's closing price is up, and subtracting the volume from the running cumulative total when security's closing price is down.
If the closing price is higher than the previous closing price for the time-frame, then the new OBV is calculated using the formula:
OBV = current OBV + Volume
If the closing price is lower than previous closing price, then the new OBV is calculated using the formula:
OBV = current OBV - Volume
How is it used?
The direction of the OBV line is more important than the value of the OBV as the OBV line indicates buying or selling strength. A rising OBV indicates increased demand for a security, which is a requirement of a strong uptrend, and a rise in the security's price can be expected.
Conversely, divergence between the OBV and a rising security price suggests that the uptrend is weak and will not persist.
In a ranging market, a rising OBV indicates a potential bullish breakout while a falling OBV indicates a bearish breakout.
Chart Example
The following chart shows the OBV indicator in the lower chart panel on a 15-minute chart of the S&P500 Futures Index. If you look closely you would notice the divergence between the indicator and the price action towards the end of the chart. This was futures trading with no real volume following the Thanks Giving holiday.
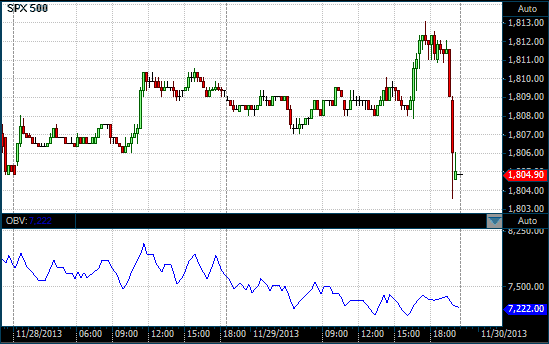
OBV on a 15 Minute S&P500 Futures chart