Momentum (MTM)
What is it?
Momentum (MTM) is a simple leading momentum indicator that is similar to the Rate of Change (RoC). Like the RoC, the Momentum (MTM) oscillator measures the pace at which a trend is accelerating or decelerating. It does this by comparing the latest price close to a price close of a specified period in the past. Thus, a 7-day MTM indicator compares the latest price close to the price close of seven days ago. Like the RoC, the MTM indicator is very sensitive to price changes and tends to be erratic.
How is it calculated?
Momentum (MTM) is simply calculated by subtracting the previous price close from the latest price close using the formula:
Momentum = Latest close - Specified close
where the specified period is any previous price close specified by the trader. The result is plotted as an unbound oscillator that oscillates above and below a center line, namely the zero line.
How is it used?
The key consideration when using MTM is the center line. When the price of the underlying security is in an uptrend, a buy signal is generated when the Momentum oscillator moves below the center line and starts to move back up. When the price of the underlying security is in a downtrend, a sell signal is generated when the Momentum oscillator moves above the center line and starts to turn back down.
Entry signals are also generated when a trend lines drawn on the Momentum oscillator is violated.
Chart Example
The following chart shows a 20-period MTM in the lower chart panel on a 30-minute chart of the Dow Jones Industrial Index.
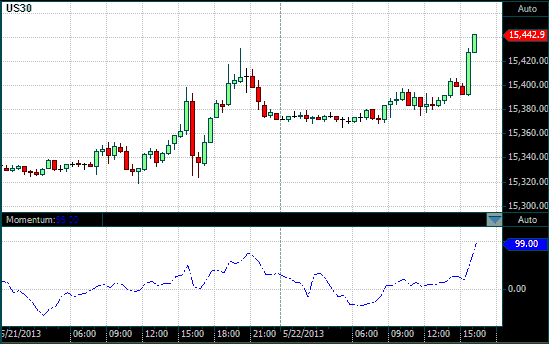
MTM on a 30 Minute DOW chart
MTM on a 30 Minute DOW chart