Moving Average Convergence/Divergence (MACD)
What is it?
The Moving Average Convergence / Divergence (MACD) is a simple oscillating trend and momentum indicator that was developed by Gerald Appel. It shows the convergence and divergence of two exponential moving averages (EMAs) by calculating the difference between the two EMAs. A signal line, which is an EMA of the MACD is added to indicate bullish and bearish conditions. Because of its construction, the MACD is both a trend indicator as it uses trend indicating moving averages (MAs) and a very effective momentum indicator. However, the MACD can be plotted as two lines that fluctuates above and below a zero line, or as a MACD histogram indicating the distance between the MACD and the signal line. When plotted as a line, the MACD has no upper or lower limit and thus does not indicate overbought or oversold conditions.
How is it calculated?
The standard MACD uses the 12-day EMA and 26-day EMA of the closing price with the shorter period and faster EMA being subtracted from the longer period and slower EMA. A 9-day EMA of difference between the two EMAs is the calculated and used as a signal line to identify the bullish or bearish turning points.
The MACD-Histogram represents the difference between the MACD (i.e., the between the two EMAs) and the signal line (i.e., the 9-day EMA of the MACD). The histogram is positive (i.e., above the zero line) when the MACD is above the signal line and negative when the MACD is below the signal line.
How is it used?
The MACD shows the convergence and divergence of two EMAs. A positive MACD value indicates that the faster moving, shorter period EMA is above the longer period EMA. This is an indication of a bullish market. When the positive values increase, it indicates an increase in momentum to the upside; and when the positive values decrease, it indicates that the uptrend in losing momentum.
A negative MACD value indicates that the faster moving, shorter period EMA is below the longer period EMA. This is an indication of a bearish market. When the negative values increase, it indicates an increase in momentum to the downside; and when the negative values decrease, it indicates that the down trend in losing momentum.
A signal line crossover indicates a turning point in the MACD. A bullish crossover occurs when the MACD line crosses up over the signal line and a bearish cross over occurs when the MACD line crosses down over the signal line. These crossovers usually suggest a trend reversal; however, a crossover when the MACD is extremely high or extremely low should be treated with caution as the MACD also indicates high momentum in these areas, which suggest a continuation of the trend rather than a reversal.
A centerline crossover (or zero line crossover) is another MACD signal. When the MACD cross up over the center line, it turns positive; indicating that the shorter period EMA has crossed up over the longer period EMA. This indicates that the trend has turned bullish. When the MACD cross down over the center line, it turns negative; indicating that the shorter period EMA has crossed down over the longer period EMA. This indicates that the trend has turned bearish.
The MACD also indicates divergence when the MACD peak or valleys of the MACD do not confirm the peaks or valley in the price movement of the underlying security. A bullish divergence occurs when the price of the underlying security makes a lower low while the MACD makes a higher low. This indicates that the downtrend is losing momentum and a bullish price reversal is probable. A bearish divergence occurs when the price of the underlying security makes a higher high while the MACD makes a lower high. This indicates that the uptrend is losing momentum and a bearish price reversal is probable.
Chart Example
The following chart shows a MACD with the default settings of 12,26,9 in the lower chart panel on a 30-minute chart of the Dow Jones Industrial Index. The blue line is the MACD line and the red line is the signal line. The green histogram plots the difference between the MACD line and the signal line.
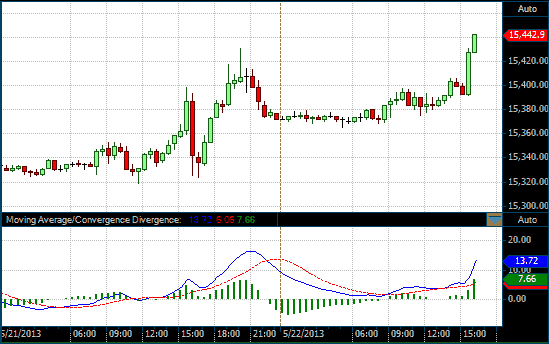
MACD on a 30 Minute DOW chart