Failure Swings
A number of indicators that are plotted in their own chart space, such as the MACD and the CCI, and especially range-bound indicators, such as the RSI and the Stochastic Oscillator, exhibit failure swings. This is a term was originally coined by J. Welles Wilder and used in his book, New Concepts in Technical Trading Systems, to refer to "very strong indications of a market reversal". Wilder used it to confirm the buy and sell signals generated by his RSI. Failure swings can, however, be applied to other indicators as well.
What is it?
A failure swing can occur when the indicator is in overbought or oversold territory and signals that the current trend is weakening and a trend reversal is highly probable. In a bullish uptrend, the indicator reaches its overbought level or its upper extremes and retreats lower only to rebound up towards its extremes again. However, the indicator fails to reach the same level as before and turns down again, making a M pattern. The failure to make a higher high is a failure swing and indicates that the uptrend is near its end and may reverse soon. Conversely, in a bearish down trend, the indicator reaches its oversold level or its lower extremes and raises up only to rebound down towards the previous lows. However, the indicator fails to reach the previous low level before turning up again, making a W pattern. The failure to take out the previous low level is a failure swing and indicates that the down trend is running out of momentum and may reverse soon.
A failure swing may coincide with positive or negative divergence between the indicator and the price action, though divergence is not a prerequisite for a failure swing.
How is it used?
A failure swing is used to enter positions in anticipation of a trend reversal. In other words, a position is taken against the current trend. The entry point is signaled when the low swing that the indicator made just before the failure swing in an uptrend, or the peak that is formed just before the failure swing in a down trend, is taken out by the subsequent movement of the indicator. In an uptrend, a short position is initiated and in a down trend a long position is initiated. These points can also be used to exit a position if you are already long in an uptrend or short in a down trend.
Chart Example
The following chart shows a 14-period RSI in the lower chart panel on a 30-minute futures chart of the Dow Jones Industrial Index. The blue line is the RSI and the red dashed line is a 5-period simple moving average (SMA) of the RSI.
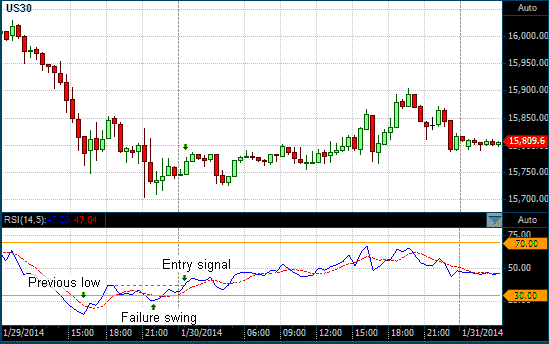
Failure swing of a 14-period RSI on a 30 Minute DOW chart
At 16:00 on January 30, 2014 the RSI reached a low of 15 before rising to 37 at 18:00. It rebounded back down but only reached a low of 26 at 21:30, signifying a failure swing. At midnight the RSI signaled a long entry when it rose above 37. At that stage the DOW was at 15,772.