Chande Momentum Oscillator (CMO)
What is it?
The Chande Momentum Oscillator (CMO) is a oscillating momentum indicator that was developed by Tushar Chande and introduced in his book, The New Technical Trader of 1994. The CMO is designed to measure what Chande calls 'pure momentum' and returns data as a line that oscillates between +100 and -100. It is similar to the Relative Strength Index (RSI) except that it measures momentum on both up days and down days. The CMO also does not use internal smoothing and thus does not obscure short-term extremes in momentum. As a result, the CMO often reaches over bought and over sold areas more regularly than momentum indicators, such as the RSI, that have internal smoothing.
How is it calculated?
The Chande Momentum Oscillator (CMO) is calculated by dividing the sum of the momentum for up days and the momentum down days by the difference of the momentum for up days and the momentum down days. The formula for the indicator is:
CMO = 100 x ( Su - Sd ) / ( Su + Sd )
where Su is the sum of the momentum of up days in the period under analysis and Sd is the sum of the momentum of down days in the period under analysis. The default period is the last 9 days.
How is it used?
The CMO oscillates between 100 and -100 and the underlying security is considered overbought when its CMO is above 50 and oversold when the CMO is below -50. Thus, when the CMO moves above the +50 it is considered bearish and entering long positions is not advised, while a move below the -50 line is considered bullish and short selling is not advised.
A cross over the centerline of CMO, i.e., a cross over 0 can also serve as confirmation of a bullish signal, when the CMO moves above 0; or a bearish signal when the CMO moves below 0.
Chande also suggests adding a 10-day simple moving average (SMA) of the raw CMO to provide trading signals before the CMO crosses the 0 line. A potential entry for a long trade is generated when the CMO crosses up over its 10-day SMA, and a potential entry signal to go short is generated when the CMO crosses down over its 10-day SMA.
As with all oscillators, buy and sell signals can also be generated by positive or negative divergence between the CMO and the underlying security.
Chart Example
The following chart is a 4-hour futures chart of the Dow Jones Industrial Index (JDI) with an 8-period CMO plotted in the lower chart panel.
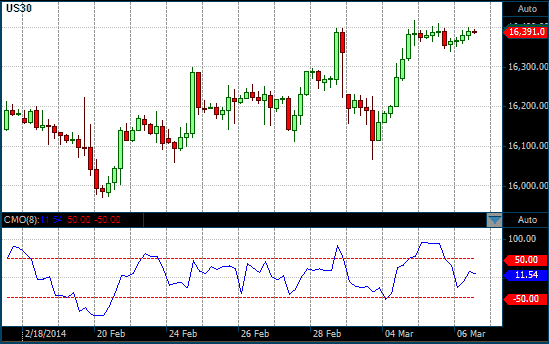
8-period CMO on a 4 Hour DJI futures chart