Bollinger Bands
What is it?
Bollinger Bands is a volatility indicator that was developed by John Bollinger and is one of the most useful bands in technical analysis. Bollinger Bands consist of three lines – a simple moving average (SMA), and two lines calculated at a specified number of standard deviations above and below the SMA. The bands indicate overbought and oversold levels relative to a moving average and can used to confirm trading signals.
Standard deviation is a statistical function that measure the probable variation from the average or the mean. One standard deviation above and below the mean theoretically contains 68.2% of the variations from the mean while two standard deviations above and below the mean contain 95.4% and three standard deviations above and below the mean contain 99.6% of the variations from the mean.
During periods of volatility i.e., during increased price fluctuation, the upper and lower bands widen and when the price fluctuations decrease, the bands contract towards the price range. They can thus be used to compare volatility and relative price levels over a period of time.
How is it calculated?
Bollinger originally used a 20-period simple moving average (SMA) for the center band, a 20-period SMA plus 2 standard deviations for the upper band, and a 20-period SMA less 2 standard deviations for the lower band. The two outer bands should theoretically contain 95.4% of the price action.
How is it used?
Bollinger Bands is a popular indicator used in mean reversion trading systems. They do not give absolute buy and sell signals when prices reach the upper or lower bands, but indicate whether the price of the security is high or low relative to the price mean (or the simple moving average (SMA)). It can also be used for a more informed confirmation of a trading signal when used with other technical indicators.
Contracting bands indicate a possible trend though the first breakout is often a false move, preceding a strong trend in the opposite direction.
A move that begins at one band normally carries through to the other band when the security is trading within a range.
For trend followers, a move outside the band indicates a strong trend is strong and likely to continue. However, mean reversion traders see it as an indication that the price is high relative to the mean, and could reverse.
A close outside the band, followed by a close inside the band, indicates a trend reversal that is confirmed when the price moves across the center band.
Chart Example
The following chart shows the standard Bollinger Bands in orange on a 30-minute chart of the Dow Jones Industrial Index. The middle (dash) line is a 20-period SMA. Notice how the bands contract during periods of low volatility and expand during periods of high volatility.
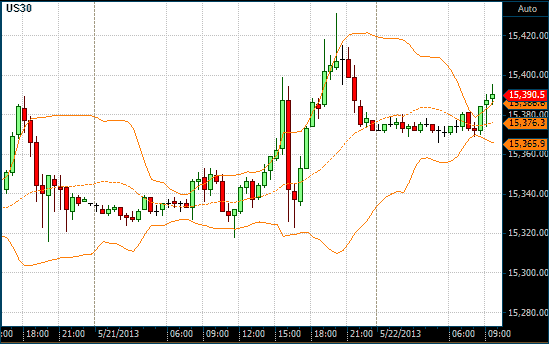
Bollinger Bands on a 30 Minute DOW chart