Average True Range (ATR)
What is it?
ATR is a volatility indicator that was developed by J. Welles Wilder and is used to measure the volatility or the degree of price movement of a security. It was introduced in Wilder's book, New Concepts in Technical Trading Systems of 1978 and was originally designed for commodity trading, which is frequently subject to gaps and limit moves. As a result, ATR takes into account gaps, limit moves, and small high-low ranges in determining the 'true' range of a commodity. However, the ATR are based on absolute values in price rather than percentage change. Therefore a commodity with a higher price tends to have a higher ATR than a lower priced commodity.
Although the ATR was designed for commodity trading, it can also be used to for other securities, such as stocks and derivatives such as single stock futures (SSFs) and index futures.
How is it calculated?
There are two steps in the calculation of the ATR: first the true range (TR) of the security is determined; and then a Moving Average (MA) is used to smooth the ATR, but the moving average is not a moving average of the TR.
The TR is the greatest of the following:
- high – low
- abs( high – previous close )
- abs( low – previous close )
Once the TR is determined, we multiply the previous ATR by the averaging period less one, add it to the current ATR and divide it by the averaging period.
Thus, if using the default period of 14 the ATR would be calculated as follows:
ATR = ( ( Previous ATR x 13 ) + Current TR ) / 14
How is it used?
ATR does not provide direction but is a strong indicator of a price break out as strong movements in the price of a security are often accompanied by large price ranges, especially at the beginning of a move. Thus, ATR can thus be used as an additional indicator to confirm a price break out. If the ATR is increasing, the support for a price breakout is also increasing.
ATR can also be used as a guide to determining stop loss levels as a security with a higher ATR will require a higher stop loss.
Chart Example
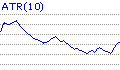
The following chart shows a 13-period ATR in the lower chart panel on a 30-minute chart of the Dow Jones Industrial Index.

ATR on a 30 Minute DOW chart