Average Directional Index (ADX)
What is it?
ADX is a lagging trend indicator designed by J. Welles Wilder, Jr. and indicates the strength of a trend, or when a stock is in a strong uptrend or downtrend, or whether it's moving sideways. It is part of an indicator system called Wilder's DMI, which was first introduced in J. Wells Wilder's book, New Concepts in Technical Trading Systems of 1978. Wilder's DMI consists of three lines: the +DI line, the -DI line and ADX line but the ADX can also be used on its own, and on any trading time frame to help you determine key turning points in the market. The ADX is an oscillator that fluctuates between 0 and 100, with values above 40 generally indicating a strong trend and values below 20 indicating a weak trend or flat trading ranges.
However, the ADX does not indicate if the trend as bullish or bearish. It merely indicates the strength of the current trend. Thus a value above 40 can indicate a strong uptrend as well as a strong downtrend. Extremely high values indicate that the trend will likely come to an end.
Also, ADX does not give entry or exit signals. It does, however, give you some perspective on where the stock is in the trend. Low readings and you have a trading range or the beginning of a trend.
How is it used?
Generally, stocks that are in a strong uptrend should be bought and held until one or more momentum indicators, such as the RSI or the CCI indicate a sign of weakness. Stocks that are in a trading range, i.e., moving sideways within a tight range should be analyzed using an oscillator indicator, such as the Stochastic Oscillator for entry and exit points.
When ADX is between 0 and 20 it indicates that the stock is in a trading range and you'd need an oscillator indicator to determine entry and exit points.
When ADX moves above 20 it indicates the beginning of a trend, though it could be an uptrend or a downtrend so remember to verify whether it is an uptrend or a downtrend before you commit to the trade.
When ADX moves above 30 it indicates the start of strong trend! This is the best time to enter a trade!
Once ADX moves above 50 it becomes more probable that the trend is coming to an end and trading ranges developing again.
Chart Example
The following chart shows a 13-period Wilder's DMI in the lower chart panel on a 30-minute chart of the Dow Jones Industrial Index. The green line is the ADX line while the blue line is the +DI line and the red line is the -DI line.
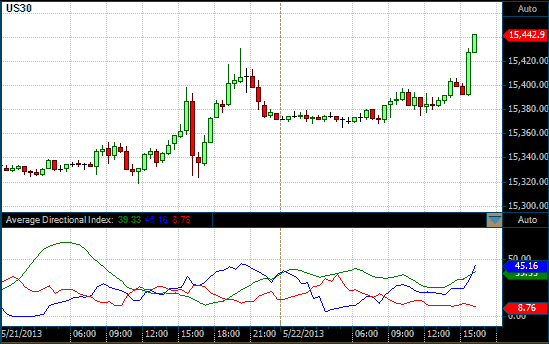
ADX on a 30 Minute DOW chart