Fibonacci Price Extensions
What is it?
Fibonacci price extensions are similar to Fibonacci price retracements. It is also support and resistance indicator that is used to determine possible support and resistance levels. Like Fibonacci fans, and Fibonacci retracements, Fibonacci extensions are based on the mathematical relationships, expressed as ratios, between the numbers in the Fibonacci summation series. Unlike Fibonacci retracements, however, Fibonacci extensions seek possible support and resistance levels that are more than 100% of the previous price movement.
How is it calculated?
The key Fibonacci extension levels are found by performing various mathematical operations on the numbers in the Fibonacci summation series, and on the results of those operations.
- The first ratio of 161.8%, which is the "golden ratio" or the "golden mean", is found by dividing a number in the sequence by the number that precedes it. For example: 21 ÷ 13 = 1.6154, 34 ÷ 21 = 1.6190 and 55 ÷ 34 = 1.6176.
- The 261.8% ratio is found by dividing a number in the sequence by the number that appears two places before it. For example: 34 ÷ 13 = 2.425, 55 ÷ 21 = 2.619 and 144 ÷ 55 = 2.61818. It is also the square of 1.618 (1.618 x 1.618 = 2.618).
- The 423.6% ratio is found by dividing a number in the sequence by the number that appears three places before it. For example: 55 ÷ 13 = 4.2308, 89 ÷ 21 = 4.2381 and 144 ÷ 34 = 4.2353. It is also the sum of 1.618 and 2.618 (1.618 + 2.618 = 4.236).
- In addition to these three ratios, the 127.2% extension level is also used. This level is the square root of 1.618 (√1.618 = 1.272).
How is it used?
Fibonacci extensions are used in a similar way as Fibonacci retracements but the opposite direction. The technical analyst identifies the trend, then waits for the market to turn against the trend and then waits for the market to start moving back in the direction of the dominant trend. The analyst then applies the extension ratios to the previous countertrend movement, or wave, starting from the previous low to the high in an uptrend and in the opposite direction in a down trend. Horizontal lines are then drawn at these levels and are used a possible resistance levels if the dominant trend is an uptrend, or as possible support levels if the dominant trend is a down trend. These thus become places at which the trader could use as price targets when trading in the direction of the dominant trend. The most significant levels are usually the 161.8% level followed by the 127.2% level. The 261.8% level and the 423.6% levels are also significant in strong markets.
Multiple Fibonacci extensions can also be drawn starting from different lows in an uptrend or different highs in a down trend. The end points for the different extensions are the same most recent turning point and can be used with Fibonacci retracement levels of larger price swings. This creates multiple levels with areas were two or more Fibonacci levels are in close proximity being more significant.
Chart Example
The following is a 1-hour chart of the GBP/USD with a Fibonacci Extension drawn on the countertrend rally from the lows made at 17:00 on November 8, 2013 to the high made at noon on November 11, 2013. The subsequent price movement back in the direction of the dominant down trend came within a few pips if the 261.8% extension level on November 12, 2013 before reversing.
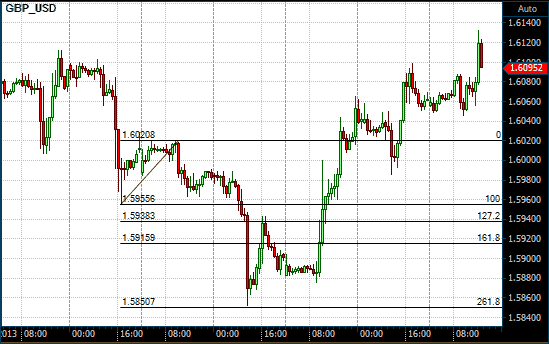
Fibonacci Extensions on a 1 Hour GBP/USD chart