Symmetrical Triangles
The Symmetrical Triangle
Symmetrical Triangles are chart patterns that can appear in an uptrend or a downtrend and are characterized by a series of higher lows and lower highs. When the support trend line joining consecutive lows and the resistance trend line joining consecutive highs are drawn, they result in a convergence of two trend lines with a degree of symmetry. These Symmetrical Triangles indicate a period of indecision when the forces of supply and demand in the market are nearly equal. During these conditions attempts to push the price up are met with selling and attempts to push the price down are met with buying. There is also a tendency for volumes to drop off during the formation of this pattern. Eventually the price will break out of the triangle, usually this break out is accompanied by an increase in volume, and is usually in the direction of the preceding trend. Elliott Waves practitioners also see Symmetrical Triangles as part of a correction that interrupts the larger trend, though the Symmetrical Triangle can also be part of a complex correction.
Entry Signal
In a Symmetrical Triangle, a strong entry signal is given when the price breaks out of the triangle in the direction of the existing trend between 50-75% into the triangle. In other words, if the trend preceding the Symmetrical Triangle is an uptrend, the price should breakout to the top, and conversely for a downtrend. If the price breaks out in the opposite direction, it is not considered valid entry signal. However, a breakout that occurs between 50-75% into the Symmetrical Triangle pattern is often more reliable while an early or late breakout is more prone to failure. Thus, if the price breaks out before the 50% point or after the 75% point of the triangle, it is not considered a valid entry signal as these break outs have a higher tendency to fail.
Price Projection
A price projection of the Symmetrical Triangle pattern can be calculated by taking the widest part of the triangle and adding it to, or subtracting it from, the breakout point, depending on the direction of the existing trend. Alternatively, a trend line can be drawn parallel to the trend line which slopes in the direction of the breakout, with the extension being the target price for the move.
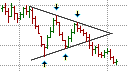
Chart Example
A Symmetrical Triangle pattern can be seen on the following daily chart of the Australian 200 (ASX 200) Index. The ASX200 was in the early stages of an uptrend when a correction took it back to the 5,000 level on August 7, 2013. It oscillated between two converging trendlines until a breakout occurred on September 2, 2013 at approximately 5,112. The projected price target is the widest part of the triangle, which is approximately 196 points, making out projected target 5,308. This target was reached on September 26, 2013.

A Symmetrical Triangle on a Daily ASX200 chart