Support and Resistance (S/R) Lines
Support and Resistance Lines
Support and Resistance lines are often confused with trend lines. However, support and resistance lines are horizontal lines drawn under the minor lows and above the highs respectively. They indicate where a previous rally met resistance that drove the price back down and where a previous decline met support that pushed the price back up. These are two important levels in terms of trend identification since an uptrend will tend to break through previous resistance levels to make higher highs while a down trend will break through the previous support levels under the market to make lower lows. When the support line below the recent minor low in broken in an uptrend, it indicates that the uptrend is weakening and may reverse soon. Similarly, when the recent resistance line in a down trend is broken, it indicates that the trend is weakening and that a trend reversal may occur. When a support or a resistance line is broken, it often swaps around to become a resistance or support line for future price movements.
How to Draw Support and Resistance Lines
Knowing where to draw the trend lines takes a little experience but improves dramatically if you can identify the minor peaks and minor troughs. Generally a minor peak is formed when the high of the bar or candlestick is higher that the high of the bars or candlesticks on either side. Larry Williams refined this method by requiring that the bar on the right cannot be an inside bar but must have a lower low. Otherwise that bar is not valid.
Support and resistance lines can also be identified in areas of congestion where prices battled to close higher or lower. These areas can be identified by the length of time the price struggled at a level and/or the amount of volume that was traded at that level.
Finally, the support and resistance lines on charts with a larger time-frame are more significant than support and resistance lines on charts with a short time-frame. Thus, the support and resistance line on a weekly chart is more significant than the support and resistance line on a daily chart; and the support and resistance line on a daily chart is more significant than the support and resistance line on an hourly chart; etc. However, old support and resistance lines tend to lose some but not all of their significance with the passage of time.
Of course, the type of chart you use will also affect how the support and resistance lines are drawn:
- On a line graph, which only plots closing prices; the support lines are drawn at the bottom the dips of the close price and the resistance lines are drawn at the top of the peaks.
- On an OHLC bar chart it is better to draw the support and resistance lines so that the spikes are ignored. This means drawing the support lines at the open or close price, depending on which is lower, and drawing resistance lines at the open or close price, depending on which is higher.
- The same applies to candlestick charts where you should ignore the wicks or shadows and draw the support lines at the bottom of the real body of the candlestick that forms the low point, and the resistance line at the top of the real body of the candlestick the forms the peak.
- Support and resistance lines on a Point-and-Figure chart is the easiest to draw as the support lines are simply at the top of the peaks and the resistances line are simply at the bottom of the dips.
There is a very good reason why support and resistance lines should be drawn at the open and close price rather than at the high or low of a bar or candlestick chart. The close price represents the consensus for that bar while the spike high or spike low represents failed attempts to push the price higher or lower. These failed attempts did not garner enough interest from other traders to move the price and are thus not significant markers of what traders believe to be the fair price at that moment in time. And we want our support and resistance lines drawn at significant levels.
Using Support and Resistance Lines
When the price moves back to a support or resistance line, it is said to be testing the support or resistance. If the support or resistance line holds, and is not violated or broken, the test is said to have failed. The more failed tests a support or resistance line has, the more significant that line becomes. When a support or resistance line is significant, they provide entry signals when a test of the line fails, as well as when a test succeeds in violating or breaking the support or resistance.
Support and resistance lines that are less significant do not provide good entry and exit signals but are more useful for identifying chart patterns and for use in conjunction with technical indicators.
Chart Example
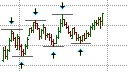
The following 15-minute Euro/USD Forex chart shows how the support level in a double tops pattern became a resistance later on. The double tops have a high of around 1.30249 that was reached at 2:15 AM and at 11:00 AM on May 14, 2013. The approximate support level is at around 1.29860. Once this support level was broken and the price projection was reached, the Euro/USD rebounded only to encounter resistance at what was once the support level.

Support becomes Resistance on the 15 Minute EUR/USD chart