The Flag Pattern
The Flag Pattern
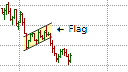
The Flag pattern is one of the short-term continuation patterns. It is quite similar to the pennant pattern with the "flag" representing a relatively short consolidation period following a sharp price movement and marks the mid-point of a longer price movement or trend. It is not a reversal pattern.
The Flag pattern occurs when the chart tracks a rapid, near vertical price movement that is followed by a short period of congestion or consolidation that is characterized by lower volumes. The initial near vertical movement forms the "flagpole" while the congestion area forms the actual flag and is caused by the profit taking of traders that were fortunate enough to be in the correct position before the flagpole formed, and by traders who missed the initial movement who are now entering the market.
The congestion area of the flag usually takes either the shape of a parallelogram that tilts in the opposite direction of the flagpole or the shape of a rectangle. Usually the consolidation period is accompanied by a decline in volumes until the beak out occurs. A valid break out would be in the same direction of the initial price movement that formed flagpole, and usually occurs after approximately 8 bars but definitely within a maximum of 20 bars. If the consolidation phase lasts longer than 20 bars then the probability that the momentum that created the initial price movement has dissipated increases and the consequent probability that the Flag pattern itself will fail increases. This is particularly true of bearish Flag patterns.
Entry Signal
In the Flag pattern, an entry signal is given when the price breaks out of the parallelogram or the rectangle that formed during the congestion area of the flag. This breakout must be in the direction of the flagpole. Ideally the break out from the flag area should consist of about 8 bars and no more than 20 bars. However, the longer consolidation phase lasts, the greater the risk of the pattern failing. Also, the break out point should be accompanied by a significant increase in volume. If the volume does not increase, the probability of a false break out increases and caution is required.
Price Projection
The minimum price projection of the Flag pattern can be calculated by taking the length of the flagpole and adding it to the breakout point in the direction of the flagpole. However, you should also consider the overall support and resistance levels on the chart to determine levels at which to consider taking partial profits.