Double Top and Double Bottom Patterns
The double tops and double bottoms patterns are two related chart patterns that are some of the easiest trend reversal patterns to identify that appear on line, bar, candlestick, and Point-and-Figure charts.
Double Tops
The Double Tops Pattern
The double tops is a bearish trend reversal pattern that often marks the end of an uptrend and the start of a down trend. It consists of two consecutive peaks that reach a resistance level at more or less the same high value, with a valley separating the two peaks. The low of the valley is important for price projection purposes, but the shape that the peaks take is not important despite some traders talking about Adam and Eve tops. Volume is also of importance, with the volume on the second peak preferably lower than the volume on the first peak.
At times, the double top pattern can form a third top, creating a triple top pattern.
Entry Signal
The double tops pattern has two entry signals to sell short. The first is given when the price fails to break the previous resistance level at the high of the first peak. However, this is a tentative entry as the price may rebound before reaching the support level between the two peaks and signal the continuation of the uptrend. The second entry signal is the more reliable signal. It is given when the previous support level created on the retracement from the first peak is violated. This should preferably occur on higher volume as a drop in volume may indicate a false break.
Price Projection
A price projection for the double tops formation can be calculated by taking the distance from the support level created on the retracement from the first peak to the top of the peak and subtracting it from the point at which the support level was subsequently broken. However, the price will usually attempt to retest the previous support level, which would now become a resistance level and may even violate this level before the down trend takes effect. Should the resistance level be broken on strong volume you should be cautious and perhaps exit the trade, looking to re-enter when the price breaks down below the resistance level.
Chart Example
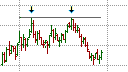
The double tops pattern can be seen on the following 15-minute Euro/USD Forex chart. The Euro/USD reached a high of 1.30249 at 2:15 AM on May 14, 2013. It reached the same approximate level at 11:00 AM with a support level at around 1.29860. The price projection for this double top pattern is 1.29471 once the support level had been breached. This projection was reached at 12:45 PM.

15 Minute EUR/USD chart with an Eve and Adam Double Top Pattern at 1.30249
Double Bottoms
The double bottom pattern is a bullish counterpart to the double tops. It often marks the end of a down trend and the possible start of a protracted uptrend. It consists of two consecutive troughs or dips that bounce of a support level at more or less the same low value, with a peak separating the two dips. Similar to the valley in the double tops, the high that the interceding peak reaches in the double bottom is important for price projection purposes, and the shape that the two dips is of much importance. Volume is also of importance here, with the ideal pattern having a lower volume on the second dip than the volume on the first dip.
As is the case with the double tops, the double bottom pattern can also make a third bottom and evolve into a triple bottom pattern.
Entry Signal
The double tops pattern provides two entry signals to buy long: first, when the price fails to break the previous support level on the second dip; and second, when the resistance level formed at the peak between the two dips is broken. The latter is the more reliable signal and becomes even more reliable when the break is accompanied by an increase in volume.
Price Projection
A price projection for the double bottom formation can be calculated by taking the distance from the resistance level of the peak between the two dips to the low of the dips and adding it to the point at which the resistance level is broken. The price may come back to retest the previous resistance level, which would now become a support level and may even violate this level before the uptrend takes effect. Should the support level be broken on strong volume you should be cautious and perhaps exit the trade, looking to re-enter when the price penetrates up through this level.