The Tasuki Candlestick Pattern
What is the Tasuki Pattern?
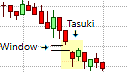
Tasuki with Falling Window
The Tasuki candlestick pattern is a rare double candlestick continuation pattern that contains a window. In Japanese candlestick charting, a gap is called a window and occurs when there is a visible gap between two consecutive candlesticks, including their shadows. It is not a window if the gap is only between the real bodies of the two candlesticks, but the shadows or wicks overlap. The gap must be between the shadows as well. A window can be a rising window, which is bullish, or a falling window, which is bearish. The two candlesticks immediately after the window form the pattern. These two candlesticks should not close the window or fill the gap.
The Tasuki candlestick pattern can be either a bullish continuation pattern, or a bearish continuation pattern, depending on the trend in which it appears. If it appears in an uptrend, it is a bullish continuation pattern and is called the Tasuki Upside Gap. If it appears in a downtrend, it is a bearish continuation pattern and is called the Tasuki Downside Gap.
Sometimes, when the Tasuki candlestick pattern fails, it is classified as a reversal pattern. We prefer classifying the Tasuki as a continuation pattern, as this is what it is if it does not fail.
The Tasuki Formation
The Tasuki candlestick pattern is a trend continuation that must appear in an existing trend. It begins with a window or a gap in the direction of the current trend. This window should not be closed as it forms a support or resistance area. Therefore, the first candlestick that forms from the window should be supportive of the trend. The second candlestick in the pattern opens within the real body of the first candlestick and closes in the area of the window, without closing the window. Should the second candlestick close the window then it would not form a Tasuki pattern.
The Tasuki Upside Gap
A Tasuki with Rising Window is called a Tasuki Upside Gap and can occur in an uptrend. The pattern begins with the first candlestick forming an up gap or rising window on its open. In other words, the candlestick gaps up to above the previous candlestick. This candlestick should be a bullish candlestick that closes higher and is therefore light in color. This bullish candlestick is followed by a bearish candlestick that opens within the real body of the first candlestick and closes below the real body of the first candlestick. It should be more or less the same size as the first candlestick and should not close the window below the first candlestick. If the second candlestick closes the window, then the pattern is invalidated.
What the Tasuki Upside Gap tells us
The market is in a clearly-defined uptrend when a rising window forms on the open of the first candlestick in the Tasuki pattern. The up gap and the size of the first candlestick indicates that the bulls are firmly in control of the market but the market may be overbought and in need a little consolidation. This consolidation occurs on the second candlestick that is a bearish candlestick that fails to close the window. The rising window is considered as support area and the failure of the bears to close the window and break the support area, is an indication of the bears are still weak and are not yet able to overcome the strength of the bulls. Therefore, the current uptrend can be expected to resume.
Trading the Tasuki Upside Gap
As the Tasuki Upside Gap is a bullish continuation pattern, it represents an opportunity for a trader to either enter a long position if they are not already holding a long position, or to add to their existing long positions. Entering a new position or adding to an existing position can be executed on the open of the candlestick that follows the Tasuki Upside Gap, with a protective stop-loss placed at the bottom of the open rising window as this is a support area. If the placement of the protective stop-loss is too far from the entry to provide a favorable risk/reward ratio, the trader could wait for a possible pull-back towards the potential support area represented by the rising window (up gap) at the start of the Tasuki Upside Gap before entering the trade. This would place the entry much closer to the protective stop and would reduce the capital at risk on the trade, though there is no guarantee that a pull-back will occur. The Tasuki Upside Gap also represents an opportunity for a trader that has an existing long position to move their protective stop-loss to the bottom of the open rising window, allowing them to potentially lock in some profit.
The Tasuki Upside Gap does not provide a profit target; therefore, other trading mechanisms or methods should be used to exit the long position. This could be previous levels of resistance or previous area of consolidation, a defined risk/reward ratio, a measured move, a Fibonacci retracement level, the appearance of a bearish candlestick formation, or a simple trailing stop.
The Tasuki Downside Gap
A Tasuki with Falling Window is called a Tasuki Downside Gap and is the opposite of the Tasuki Upside Gap. The Tasuki Downside Gap can appear in a downtrend where it begins with the first candlestick forming a down gap or falling window on its open. In other words, the candlestick gaps down to below the candlestick that preceded it. This first candlestick should be a bearish candlestick that closes lower than its open and is therefore a dark-colored candlestick that is supportive of the current downtrend. This bearish candlestick is followed by a bullish candlestick that opens within the real body of the first candlestick and closes above the real body of the first candlestick. As with the Tasuki Upside Gap, the second candlestick should be more or less the same size as the first candlestick and should not close the window above the first candlestick. If the second candlestick closes the window, then the pattern is invalidated.
What the Tasuki Downside Gap tells us
The when the Tasuki Downside Gap begins to form, market is in a clearly-defined downtrend. The falling window that forms on the open of the first candlestick in the Tasuki pattern and the size of the first candlestick indicates that the bears are still in control of the market. The market, however, may be oversold and in need a bit of a correction. This correction occurs on the second candlestick that is a bullish candlestick that fails to close the window. Here the falling window is considered as resistance area and the failure of the bulls to close the window and break the resistance area, is an indication of the bulls are still too weak to overcome the strength of the bears. As a result, the current downtrend would be more likely to resume.
Trading the Tasuki Downside Gap
The Tasuki Downside Gap represents an opportunity for a trader to either enter a short position if they are not already holding a short position, or to add to their existing short positions. Entering a new short position or adding to an existing short position can be performed at the open of the candlestick that follows the Tasuki Downside Gap. A protective stop-loss could be placed at the top of the open falling window as this is a resistance area. If the placement of the protective stop-loss is too far from the entry to provide a favorable risk/reward ratio, the trader could wait for a possible pull-back towards the potential support area represented by the open falling window at the start of the Tasuki Downside Gap before entering the trade. This would place the entry much closer to the protective stop and would reduce the capital at risk on the trade, though there is no guarantee that a pull-back will occur. The Tasuki Downside Gap also represents an opportunity for a trader that has an existing short position to move their protective stop-loss to the top of the open falling window, allowing them to potentially lock in some of their profit.
The Tasuki Downside Gap does not provide a profit target but previous levels of support or previous area of consolidation could be used as an initial price target to exit the short position. A trader could also implement a profit target based on a defined risk/reward ratio, a measured move, or some other trading mechanism, such as a Fibonacci retracement level, the appearance of a bearish candlestick formation, or a simple trailing stop.