The Engulfing Candlestick Pattern
What is the Engulfing Pattern?
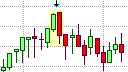
Bullish and Bearish Engulfing Pattern
The Engulfing pattern is called tsutsumi in Japanese and is a major trend reversal pattern. It is similar to the Outside Day reversal pattern and is the inverse of the Harami pattern with the exception that the candlesticks that make up the pattern cannot be of the same color.
The Engulfing Formation
Like the Harami pattern, the Engulfing pattern is a double candlestick pattern that consists of two candlesticks with the first candlestick being a relatively short candlestick with a short real body that is supportive of the current trend. The second candlestick is a larger candlestick that gaps away from the first candlestick's close in the direction of the trend. This candlestick then reverses direction with a larger real body that completely engulfs the real body of the first candlestick. Hence, the two candlesticks that form this pattern cannot have the same color. Note that the real body of the second candlestick need not engulf the shadows of the first candlestick; it only needs to engulf the real body.
The Engulfing pattern can be either bearish or bullish, depending on the trend in which it appears on the price chart.
The Engulfing Formation
The Engulfing pattern should appear in an existing trend for it to be of significance. The first candlestick in the formation must be supportive of the current trend. The second candlestick in the pattern then gaps away from the first candlestick in the direction of the trend only to changes direction and exceeds the length of the real body of the first candlestick, completely engulfing the real body of the first candlestick.
The Bullish Engulfing Pattern
The bullish Engulfing pattern must appear in a downtrend. The first candlestick in this formation must be supportive of the downtrend and must thus be a black or dark-colored candlestick that closes lower than where it opened. This suggests that the trend is continuing, as does the open of the second candlestick, which gaps down and opens lower than the close of the first candlestick. However, the second candlestick changes direction and exceeds the length of the real body made of the first candlestick, closing higher than the open of the first candlestick. As the second candlestick's close is higher than its open, it is a white candlestick; and as its open is lower than the close of the first candlestick and its close is higher than the open of the first candlestick, its real body is larger than the first candlestick and completely engulfs the first candlestick's real body. The smaller real body of the first candlestick indicates a degree of indecision and uncertainty in the downtrend and the larger body of the second candlestick indicates that demand has exceeded supply and that the onset of an uptrend is very possible.
What the Bullish Engulfing Pattern tells us
The bullish Engulfing pattern that appears in a downtrend gives a clear indication of a reversal in market sentiment. This reversal begins on the first candlestick that is relatively small with a relatively short real body when compared to the other candlesticks that preceded it in the trend. This is an early sign that the downtrend is waning and weakening. The second candlestick confirms this weakness as it completely negates the price movement of the previous candlestick and closes higher than the first candlestick. This is a clear indication that sentiment has shifted to the upside.
Trading the Bullish Engulfing Pattern
A trader would look to close any short position they may be holding, and take a long (buy) position immediately, following the appearance of a bullish Engulfing pattern in a downtrend. A logical place for a stop loss when taking a long position would be below the low of the Engulfing's lowest shadow, which could be a potential support area. However, the length of the second Engulfing candlestick may increase the risk of the trade given its distance from the protective stop-loss. If this risk is too great, a trader could wait for a correction towards the area of the Engulfing's low before taking a long position. This would place the entry much closer to the protective stop and would reduce the capital at risk on the trade. It would also be close to the potential support area at the low of the Engulfing's lower shadow. However, there is no guarantee that a correction towards the support area will take place.
The bullish Engulfing pattern does not provide a profit target but a trader could implement a profit target based on a measured moved defined by an acceptable risk/reward ratio or some other trading mechanism can be used to exit the trade. This could be a Fibonacci retracement level, the appearance of a bearish candlestick formation, or a simple trailing stop.
The bullish Engulfing pattern is more reliable if it appears at or near a support line or a trend line. This is further enhanced when the volumes on the second candlestick are higher than the volumes on the first candlestick.
The Bearish Engulfing Pattern
The bearish Engulfing patterns should appear in an uptrend and marks the possible reversal of the uptrend. The first candlestick in this formation must be in the direction of the uptrend and must thus be a white candlestick with a closing price that is higher than its opening price. This implies that the uptrend is still strong. The second candlestick gaps up to open above the close of the first candlestick but then reverses to close below the open of the first candlestick, engulfing it completely. As is the case in the bullish Engulfing pattern, the smaller real body of the first candlestick indicates a degree of indecision and uncertainty about the uptrend. Then larger body of the second candlestick indicates that supply has exceeded demand and that the onset of a downtrend is very possible.
What the Bearish Engulfing Pattern tells us
The bearish Engulfing pattern is the opposite to the bullish Engulfing pattern. It appears in an uptrend and gives a clear indication of a reversal in market sentiment but to the downside. This reversal begins on the first candlestick that, while it is bullish, has a relatively small real body in comparison to the other candlesticks that immediately preceded it in the uptrend. This is an early sign that the uptrend is weakening. The second candlestick confirms this weakness as it completely negates the price movement of the previous candlestick and closes lower than the first candlestick. This is a clear indication that sentiment has shifted to the downside and a downtrend can be expected to emerge.
Trading the Bearish Engulfing Pattern
The bearish Engulfing pattern is in the same way as the bullish Engulfing pattern but to the downside rather than the upside. A trader would thus look to close any open long position and short (sell) the market, after the appearance of a bearish Engulfing pattern in an uptrend. Here a logical place for a protective stop-loss would be above the high of the Engulfing's highest shadow, which could be a potential resistance area. However, the length of the second Engulfing candlestick may increase the risk of the trade given its distance from the protective stop loss. If this risk is too great, a trader could wait for a pull-back towards the area of the Engulfing's high before taking a short position. This would place the entry much closer to the protective stop and would reduce the capital at risk on the trade. It would also be close to the potential resistance area at the high of the Engulfing's higher shadow. However, there is no guarantee that a pull-back will occur.
The bearish Engulfing pattern also does not provide a profit target so some other trading mechanism would be required to exit the trade. This could be a profit target based on a measured moved defined by an acceptable risk/reward ratio, a key Fibonacci retracement level, the appearance of a bullish candlestick formation, or a simple trailing stop.
The bearish Engulfing pattern is also more reliable if it appears at or near a resistance line or a trend line. This is further enhanced when the volumes on the second candlestick are higher than the volumes on the first candlestick.