Candlestick Patterns
Candlestick Patterns
Japanese candlestick patterns are based on candlestick charts and are recurring chart patterns that consist of only a few candlesticks, usually in the region of one to five candlesticks. Because candlesticks give an indication of market psychology and the strength and weakness of the current price movement, the candlestick patterns tend provide clearer and usually earlier indications of the probability of a possible trend reversals than any of the other chart types. In this sense, candlestick patterns can be seen as a leading indicator that are more reliable. They also tend to increase the profitability of trading these chart patterns as the trader is able to enter the trade at a more opportune moment with a relatively tight protective stop. This is one of the key reasons why Japanese candlestick charts have become rather popular in recent years, especially among short-term traders. In addition, candlestick patterns can be used as a standalone system for reading the market, though it is best used in fast moving markets. However, candlestick patterns are not infallible and can fail. It is therefore best to augment candlesticks with other techniques, such as indicators, trend lines, and Fibonacci levels, to reduce false signals.
Some candlestick patterns, such as the Harami and the Spinning Top, can be either bullish or bearish, depending on where they occur on the chart and the type of trend that they appear in. Candlestick patterns consisting of two or more candlesticks can be trend reversal or continuation patterns, however, single candlestick patterns are trend reversal patterns only. The reliability of a candlestick pattern depends on the location of the pattern within the price chart, in terms of where it appears in an existing trend, and in relation to possible support and resistance lines, or other trend lines or pivot points. The time-frame of the chart is also of importance as candlestick patterns on short time-frame, intra-day charts tend to be less reliable than patterns on charts of a longer time-frame. Another possible consideration in determining the reliability of a candlestick pattern is the volume traded when the candlestick pattern is formed. If the pattern is formed on low volume, the pattern tends to be less reliable.
In addition, candlestick patterns can be either a trend reversal pattern or a trend continuation pattern. Trend reversal patterns indicate that the current trend is running out of steam or is over extended and will probably reverse in direction in the next few bars. Reversal candlestick patterns usually require a few candlesticks only. Continuation candlestick patterns follow a short period of correction or consolidation and usually require more candlesticks. However, the overwhelming majority of candlestick patterns are trend reversal patterns.
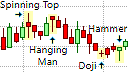
There are literally hundreds of candlestick patterns but not all of them appear with great regularity, and not all of them have a high degree of reliability and profitability. The more commonly occurring candlestick patterns include the bullish and bearish Engulfing pattern, the Harami, Hanging Man and Hammer patterns, Doji or Star patterns, and the Tweezer Top and Tweezer Bottom patterns. We will focus more on the commonly occurring and high probability candlestick patterns than the more obscure patterns.